QUESTION 1:
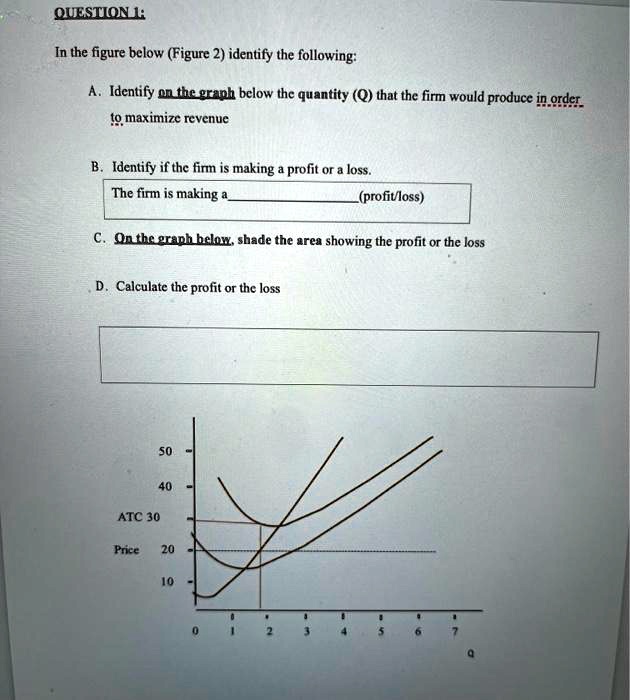
In the figure below (Figure 2) identify the following:
A. Identify on the graph below the quantity (Q) that the firm would produce in order
to maximize revenue
B. Identify if the firm is making a profit or a loss.
The firm is making a (profit/loss)
C. On the graph below, shade the area showing the profit or the loss
D. Calculate the profit or the loss
50
40
ATC 30
Price
20
10
0
1
2
3
4
5
6
7
Q