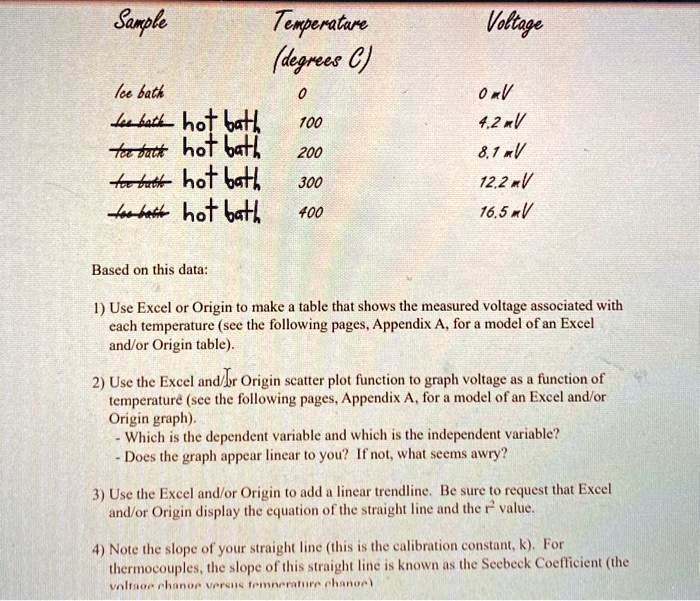
Sample
Temperature
(degrees C)
Voltage
Ice bath
0
0 mV
Ice bath hot bath
100
4.2 mV
Ice bath hot bath
200
8.1 mV
Ice bath hot bath
300
12.2 mV
Ice bath hot bath
400
16.5 mV
Based on this data:
1) Use Excel or Origin to make a table that shows the measured voltage associated with
each temperature (see the following pages, Appendix A, for a model of an Excel
and/or Origin table).
2) Use the Excel and/or Origin scatter plot function to graph voltage as a function of
temperature (see the following pages, Appendix A, for a model of an Excel and/or
Origin graph).
- Which is the dependent variable and which is the independent variable?
- Does the graph appear linear to you? If not, what seems awry?
3) Use the Excel and/or Origin to add a linear trendline. Be sure to request that Excel
and/or Origin display the equation of the straight line and the $r^2$ value.
4) Note the slope of your straight line (this is the calibration constant, k). For
thermocouples, the slope of this straight line is known as the Seebeck Coefficient (the
voltage change versus temperature change)