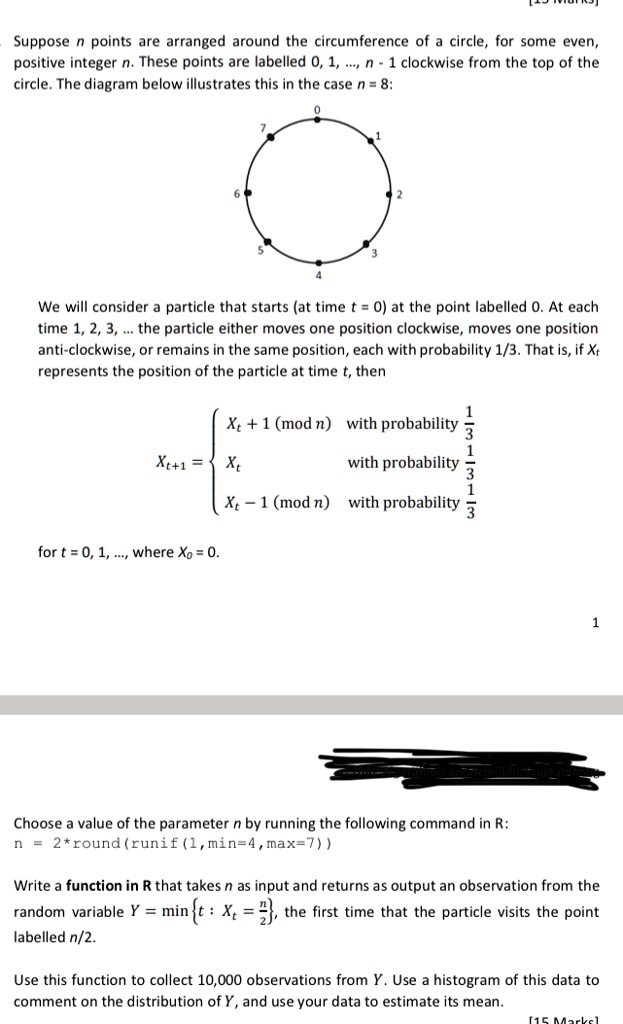
Suppose n points are arranged around the circumference of a circle, for some even, positive integer n. These points are labelled 0, 1, ..., n - 1 clockwise from the top of the circle. The diagram below illustrates this in the case n = 8:
We will consider a particle that starts (at time t = 0) at the point labelled 0. At each time 1, 2, 3, ... the particle either moves one position clockwise, moves one position anti-clockwise, or remains in the same position, each with probability 1/3. That is, if $X_t$ represents the position of the particle at time t, then
$X_{t+1} = \begin{cases} X_t + 1 \pmod{n} & \text{with probability } \frac{1}{3} \\ X_t & \text{with probability } \frac{1}{3} \\ X_t - 1 \pmod{n} & \text{with probability } \frac{1}{3} \end{cases}$
for t = 0, 1, ..., where $X_0 = 0$.
Choose a value of the parameter n by running the following command in R:
n = 2*round(runif(1, min=4, max=7))
Write a function in R that takes n as input and returns as output an observation from the random variable $Y = \min\{t : X_t = \frac{n}{2}\}$, the first time that the particle visits the point labelled n/2.
Use this function to collect 10,000 observations from Y. Use a histogram of this data to comment on the distribution of Y, and use your data to estimate its mean.