Price (dollars per diamond)
7,000
6,000
5.000
4,000
3,000
A
B
2,000
1,000
Sus
Sus + quota
World
price
Dus
0
100 300 500 700 900 1,100 1,300
Quantity (thousands of diamonds)
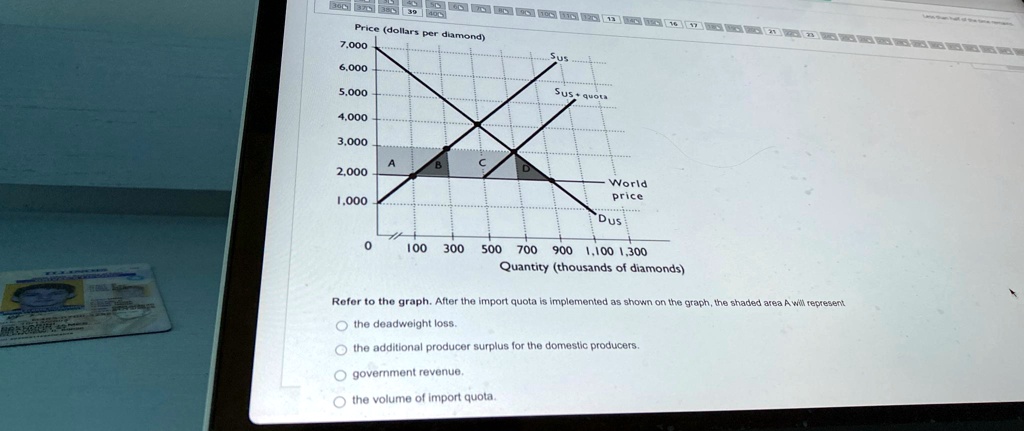
Refer to the graph. After the import quota is implemented as shown on the graph, the shaded area A will represent
the deadweight loss.
the additional producer surplus for the domestic producers.
government revenue.
the volume of import quota.