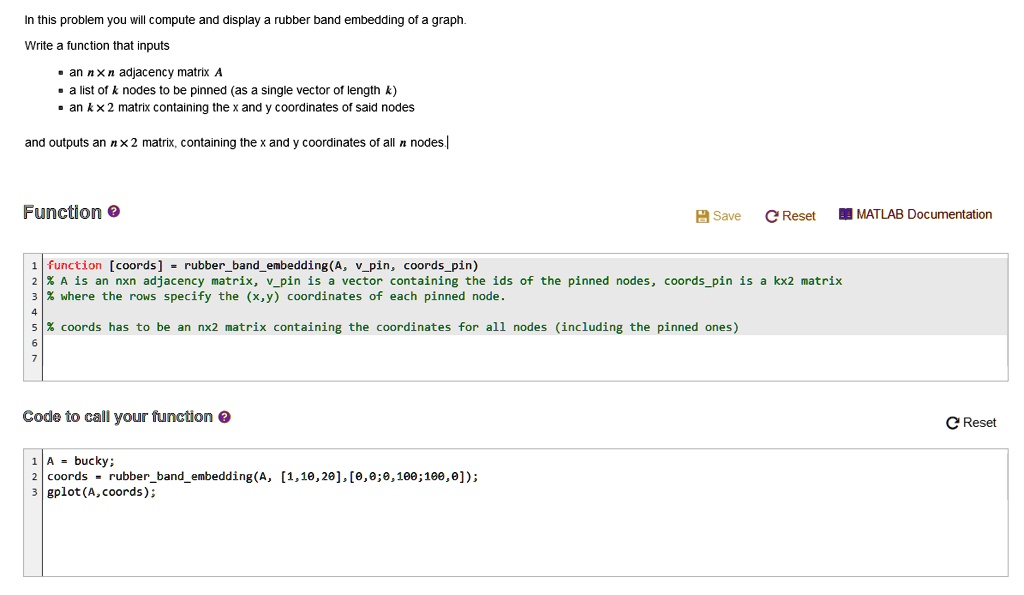
In this problem you will compute and display a rubber band embedding of a graph.
Write a function that inputs
\begin{itemize}
\item an $n \times n$ adjacency matrix $A$
\item a list of $k$ nodes to be pinned (as a single vector of length $k$)
\item an $k \times 2$ matrix containing the x and y coordinates of said nodes
\end{itemize}
and outputs an $n \times 2$ matrix, containing the x and y coordinates of all $n$ nodes.
Function
1 function [coords] = rubber_band_embedding(A, v_pin, coords_pin)
2 \% A is an nxn adjacency matrix, v_pin is a vector containing the ids of the pinned nodes, coords_pin is a kx2 matrix
3 \% where the rows specify the (x,y) coordinates of each pinned node.
4
5 \% coords has to be an nx2 matrix containing the coordinates for all nodes (including the pinned ones)
6
7
Code to call your function
1 A = bucky;
2 coords = rubber_band_embedding(A, [1,10,20], [0,0;0,100;100,0]);
3 gplot(A,coords);