Question 11, P8-18 (similar to)
Part 1 of 3
HW Score: 0%, 0 of 20 points
Points: 0 of 1
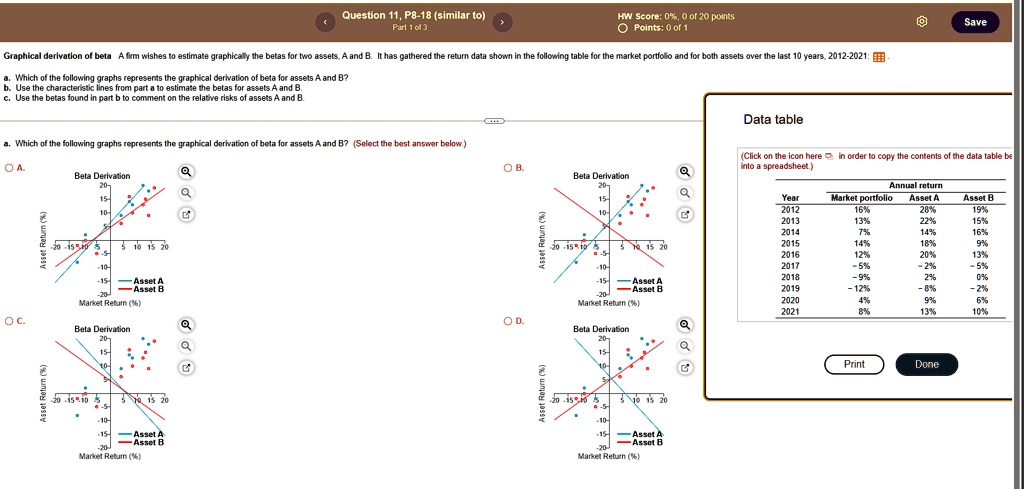
Graphical derivation of beta A firm wishes to estimate graphically the betas for two assets, A and B. It has gathered the return data shown in the following table for the market portfolio and for both assets over the last 10 years, 2012-2021:
a. Which of the following graphs represents the graphical derivation of beta for assets A and B?
Data table
(Click on the icon here in order to copy the contents of the data table be
into a spreadsheet.)
Annual return
Year Market portfolio Asset A Asset B
2012 16% 28% 19%
2013 13% 22% 15%
2014 7% 14% 16%
2015 14% 18% 9%
2016 12% 20% 13%
2017 -5% -2% -5%
2018 -9% -2% 0%
2019 -12% -8% -2%
2020 4% 9% 6%
2021 8% 13% 10%
b.
Use the characteristic lines from part a to estimate the betas for assets A and B.
c. Use the betas found in part b to comment on the relative risks of assets A and B.
a. Which of the following graphs represents the graphical derivation of beta for assets A and B? (Select the best answer below.)