Ace - AI Tutor
Ask Our Educators
Textbooks
My Library
Flashcards
Scribe - AI Notes
Notes & Exams
Download App
michelle king

michelle k.

Divider

Questions asked

BEST MATCH

Why cannot one determine the relative acid strengths of $$HClO_4$$ and $$HNO_3$$ using aqueous solutions of these acids? The acids are insufficiently soluble for the measurements. A more basic solvent than $$H_2O$$ must be used. $$H_2O$$ is too basic a solvent for the distinction to be made. These oxidizing acids cause redox reactions to occur. Actually, the acid strengths can be determined using aqueous solutions.

View Answer
divider
BEST MATCH

22. The Tacoma Narrows Bridge collapse is an example of A. standing water waves B. sound vibration C. resonance D. dispersion

View Answer
divider
BEST MATCH

If an applicant for insurance lies or omits material information on their application, what is the remedy for the insurance company? The contract is voidable by the insurance company The contract is void The contract is considered illegal The insurance company has no remedy

View Answer
divider
BEST MATCH

According to Dugan, Implicit Leadership Theory includes ALL except__________. Consciousness of self Use of prototypes Social stratification Cultural contingency

View Answer
divider
BEST MATCH

image.png When the cell is going toward the probe, the reflected frequency is _____ the original frequency. image.png When the cell is going toward the probe, the reflected frequency is _____ the original frequency. equal to higher than lower than

View Answer
divider
BEST MATCH

The belief that one's culture is superior to another culture is called:

View Answer
divider
BEST MATCH

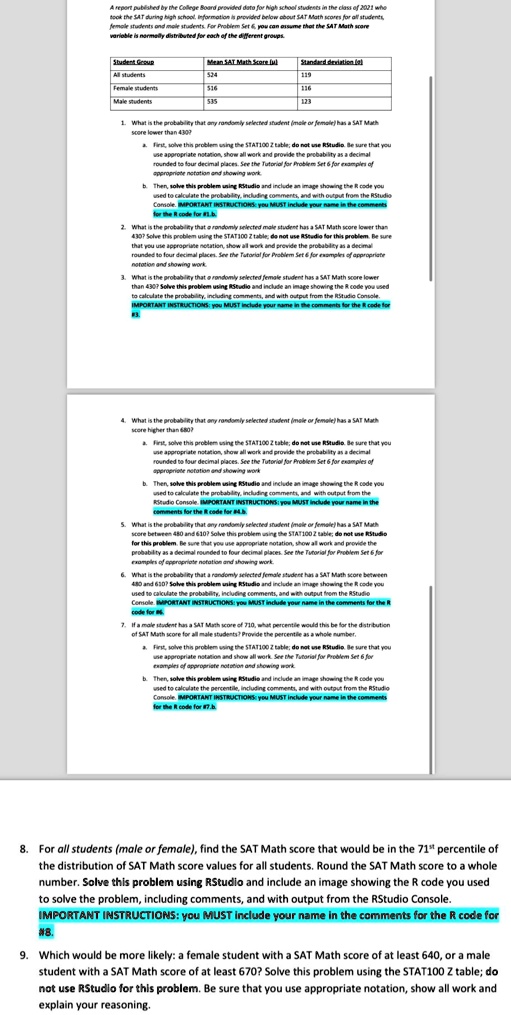
Ignore the questions that talk about RStudio (the questions with yellow highlighter) In the class of 2021, where scores for all students who took the SAT during high school. For Problem Set 6, you have 524 students. 1. What is the probability that a student has a SAT Math score lower than 430? Express the probability as a decimal rounded to four decimal places. See the Tutorial for Problem Set 6 for examples. 2. What is the probability that a student has a SAT Math score higher than 680? Express the probability as a decimal rounded to four decimal places. Solve this problem using the STAT100 Z table; do not use RStudio. Be sure to use appropriate notation, show all work, and provide the probability as a decimal rounded to four decimal places. See the Tutorial for Problem Set 6 for examples. 3. What is the probability that a student (male or female) has a SAT Math score between 480 and 610? Solve this problem using RStudio and include an image showing the R code you used to calculate the probability, including comments, and with output from the RStudio Console. IMPORTANT INSTRUCTIONS: you MUST include your code for this problem. 4. If a male student has a SAT Math score of 710, what percentile is this score for all male students? Provide the percentile as a whole number. Solve this problem using the STAT100 Z table; do not use RStudio. Be sure to use appropriate notation and show all work. See the Tutorial for Problem Set 6 for examples. 5. For all students (male or female), find the SAT Math score that would be in the 71st percentile of the distribution of SAT Math score values for all students. Round the SAT Math score to a whole number. Solve this problem using RStudio and include an image showing the R code you used to solve the problem, including comments, and with output from the RStudio Console. IMPORTANT INSTRUCTIONS: you MUST include your name in the comments for the R code for this problem. 6. Which would be more likely: a female student with a SAT Math score of at least 640, or a male student with a SAT Math score of at least 670? Solve this problem using the STAT100 Z table; do not use RStudio. Explain your reasoning.
View Answer
divider
BEST MATCH

Remember, an estimator is still a random variable. That means the \( \hat{p} \) we calculated in Part B is just one instance from some underlying sampling distribution for \( \hat{p} \). Let's take a look at what this underlying distribution look like. The cell below loads a table containing 1000 instances of the above trials. That is, we opened 10 boxes and, for each box, recorded the number of chocolates that we observed before one was unfilled. Then we repeated that process 1000 times. That's a lot of chocolate. Calculate the \( \hat{p} \) for each instance of the data. This should result in a vector of length 1000 . Then plot a histogram of these \( \hat{p} \) values. Save four statistics from these \( \hat{p} \) 's: - The sample mean as p. hat.sample. mean . - The sample standard deviation as p. hat. sample. sd . - The sample minimum as p. hat . sample. min . - The sample maximum as p. hat. sample. max . \[ \begin{array}{l} \text { chocolate. data }=\text { read. } \operatorname{csv}(\text { "more_chocolate. csv" }) \\ \text { chocolate.data }=\text { chocolate.data }[-1] \\ \text { head }(\text { chocolate. data }) \end{array} \] A data.frame: \( 6 \times 10 \) \begin{tabular}{rrrrrrrrrrr} & \begin{tabular}{r} box1 \\ <ints \end{tabular} & box2 & box3 & box4 & box5 & box6 & box7 & box8 & box9 & box10 \\ \hline 1 & 0 & 1 & 1 & 6 & 1 & 4 & 4 & 0 & 1 & 9 \\ 2 & 0 & 6 & 1 & 8 & 1 & 0 & 0 & 2 & 0 & 5 \\ 3 & 0 & 6 & 2 & 3 & 1 & 0 & 0 & 2 & 1 & 0 \\ 4 & 3 & 6 & 2 & 2 & 2 & 3 & 0 & 6 & 0 & 3 \\ 5 & 1 & 2 & 0 & 0 & 2 & 2 & 3 & 0 & 2 & 2 \\ 6 & 0 & 1 & 0 & 0 & 2 & 0 & 0 & 2 & 4 & 3 \end{tabular}

View Answer
divider
BEST MATCH

When economists say that the Federal Reserve Banks are bankers' banks, it means that bankers set the policies for Federal Reserve Banks. they perform the same functions for banks as banks perform for the public. the Federal Reserve owns the buildings. Federal Reserve Banks are owned by banks.

View Answer
divider
BEST MATCH

If you want to assign a macro to a button form control, the display text of the button does not have to match the name of the macro.

View Answer
divider