Earnings and Cash Flows:
Wal-Mart Stores
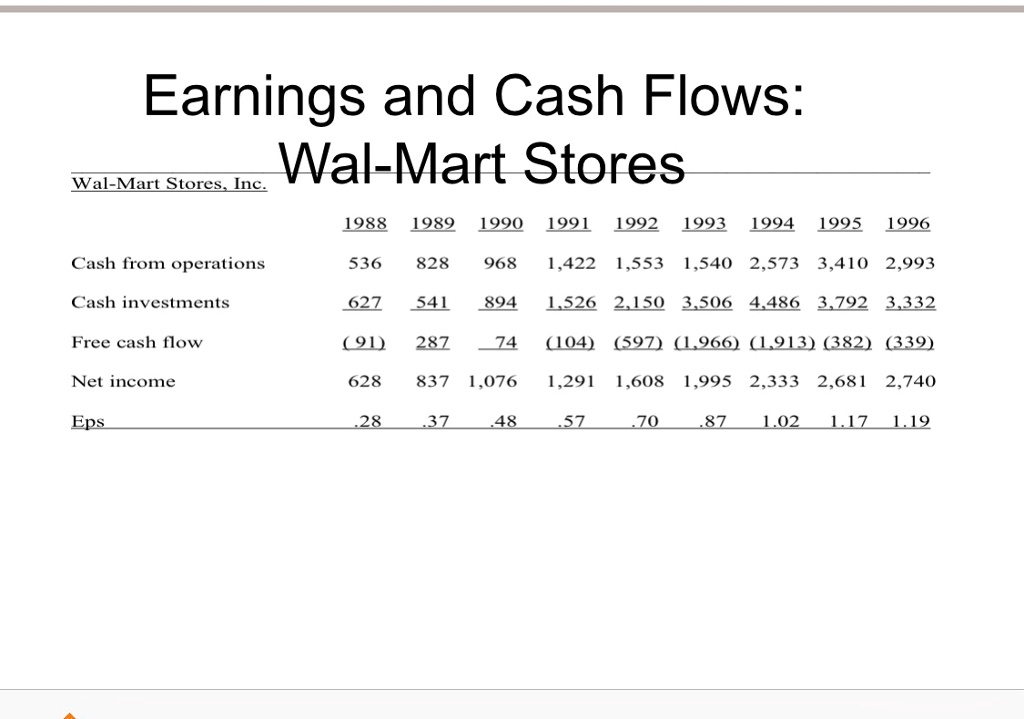
Wal-Mart Stores, Inc.
1988 1989 1990 1991 1992 1993 1994 1995 1996
Cash from operations
536 828 968 1,422 1,553 1,540 2,573 3,410 2,993
Cash investments
627 541 894 1,526 2,150 3,506 4,486 3,792 3,332
Free cash flow
(91) 287 74 (104) (597) (1,966) (1,913) (382) (339)
Net income
628 837 1,076 1,291 1,608 1,995 2,333 2,681 2,740
Eps
.28 .37 .48 .57 .70 .87 1.02 1.17 1.19