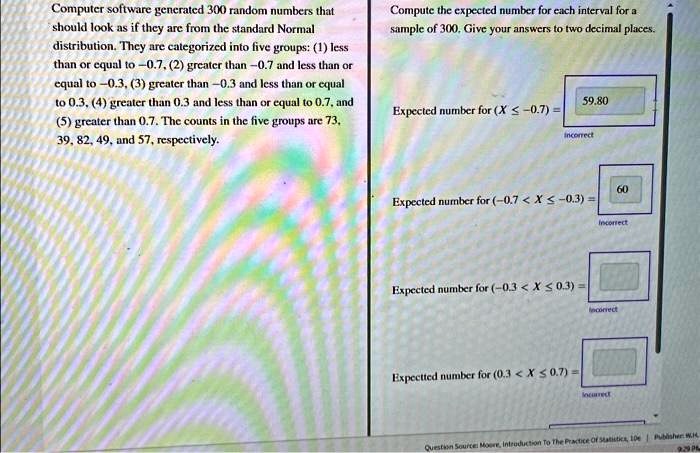
Computer software generated 300 random numbers that should look as if they are from the standard Normal distribution. They are categorized into five groups: 1) less than or equal to -0.7, 2) greater than 0.7 and less than or equal to -0.3, 3) greater than -0.3 and less than or equal to 0.3, 4) greater than 0.3 and less than or equal to 0.7, and 5) greater than 0.7. The counts in the five groups are 73, 39, 82, 49, and 57, respectively.
Compute the expected number for each interval for a sample of 300. Give your answers to two decimal places.
59.80
Expected number for X ≤ -0.7: 60
Expected number for -0.7 < X ≤ -0.3: 30
Expected number for -0.3 < X ≤ 0.3: 60
Expected number for 0.3 < X ≤ 0.7: 60
Expected number for 0.7 < X: 60
Source: More Introduction To The Practice
Publisher: W. SouMore
ISBN: 10PsbhshenW.