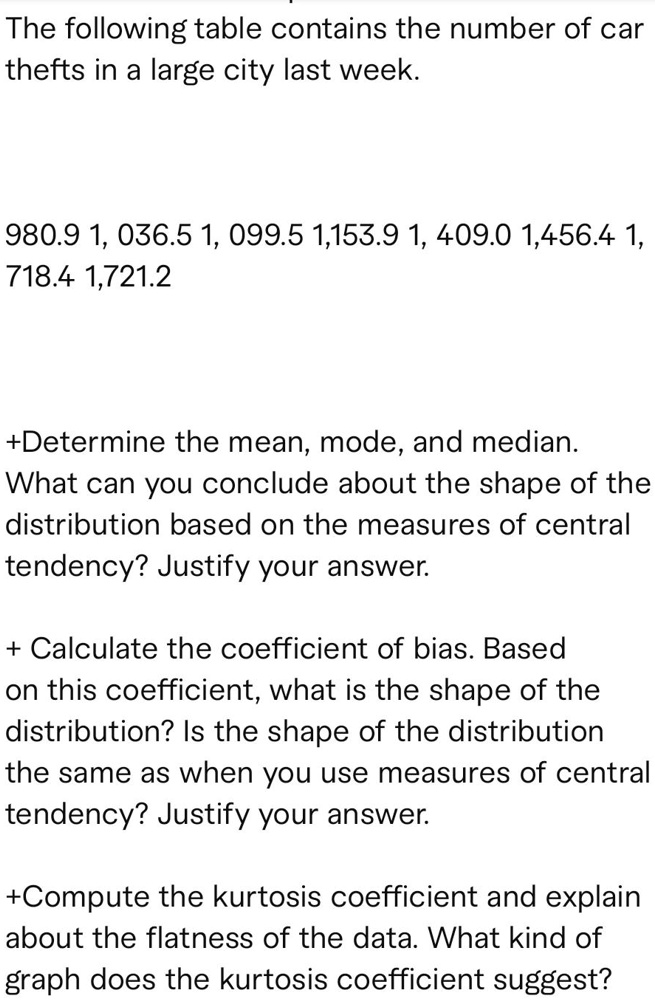
The following table contains the number of car thefts in a large city last week.
980.9 1, 036.5 1, 099.5 1,153.9 1, 409.0 1,456.4 1,
718.4 1,721.2
+Determine the mean, mode, and median.
What can you conclude about the shape of the distribution based on the measures of central tendency? Justify your answer.
+ Calculate the coefficient of bias. Based on this coefficient, what is the shape of the distribution? Is the shape of the distribution the same as when you use measures of central tendency? Justify your answer.
+Compute the kurtosis coefficient and explain about the flatness of the data. What kind of graph does the kurtosis coefficient suggest?