Previous page
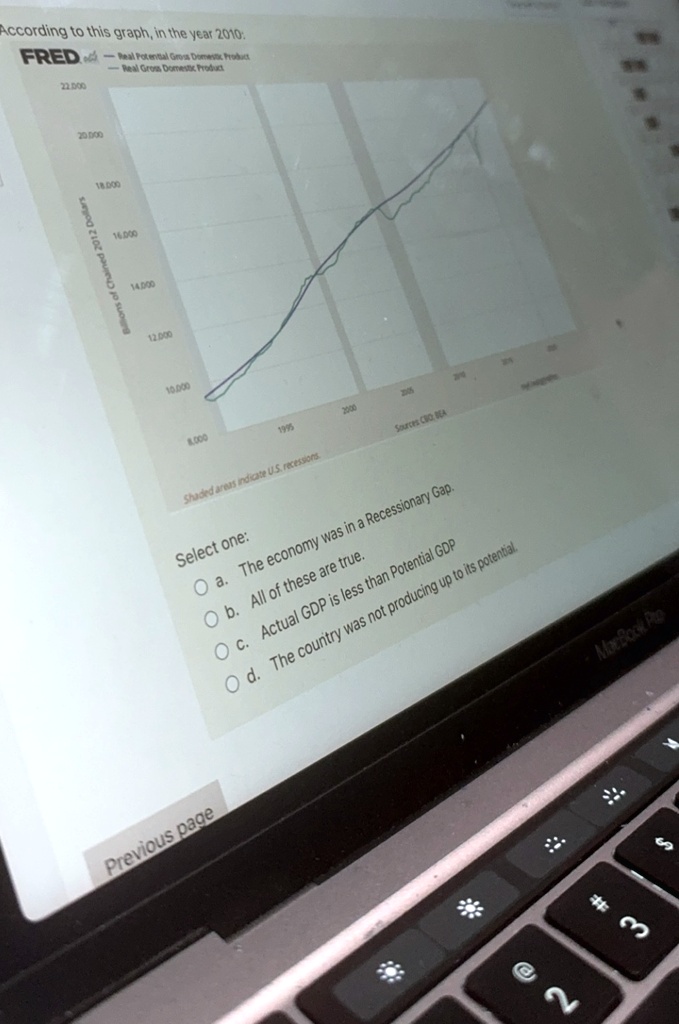
According to this graph, in the year 2010:
FRED
Real Potential Gross Domestic Product
Real Gross Domestic Product
Billions of Chained 2012 Dollars
22.000
20.000
18,000
16,000
14,000
12.000
10.000
8,000
1995
2000
2005
Sources CBO, BEA
Shaded areas indicate U.S. recessions.
Select one:
a. The economy was in a Recessionary Gap.
b. All of these are true.
c. Actual GDP is less than Potential GDP
d. The country was not producing up to its potential.