Do a two-sample test for equality of means assuming unequal variances. Calculate the $p$-value using Excel.
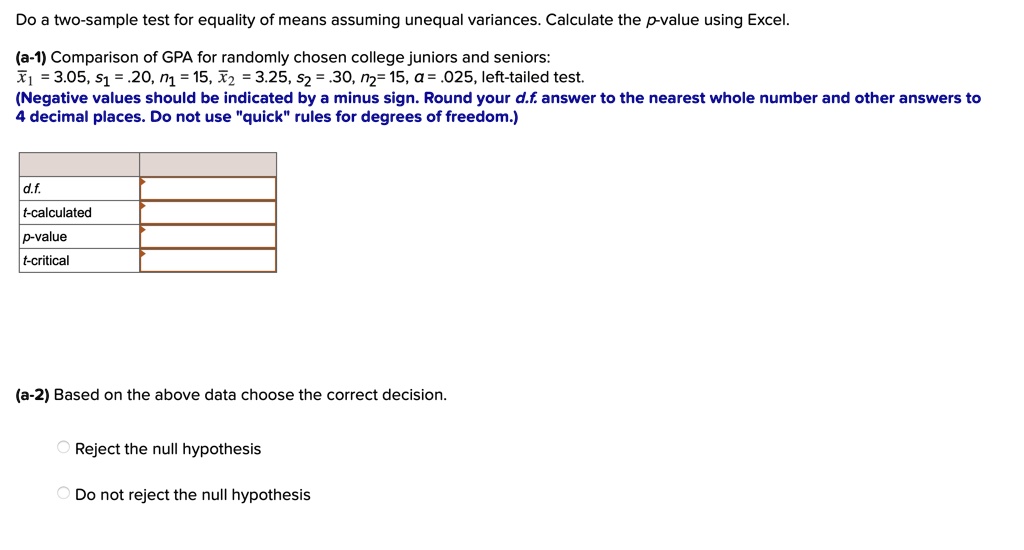
(a-1) Comparison of GPA for randomly chosen college juniors and seniors:
$\bar{x}_1 = 3.05$, $s_1 = .20$, $n_1 = 15$, $\bar{x}_2 = 3.25$, $s_2 = .30$, $n_2 = 15$, $\alpha = .025$, left-tailed test.
(Negative values should be indicated by a minus sign. Round your $d.f.$ answer to the nearest whole number and other answers to
4 decimal places. Do not use \"quick\" rules for degrees of freedom.)
d.f.
t-calculated
p-value
t-critical
(a-2) Based on the above data choose the correct decision.
Reject the null hypothesis
Do not reject the null hypothesis