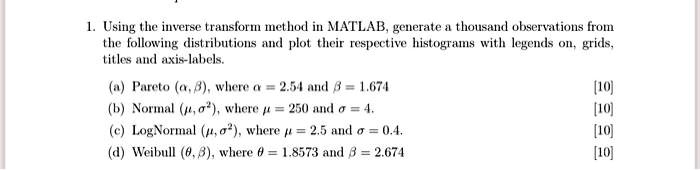
1. Using the inverse transform method in MATLAB, generate a thousand observations from the following distributions and plot their respective histograms with legends on, grids, titles and axis-labels.
(a) Pareto ($\alpha$, $\beta$), where $\alpha$ = 2.54 and $\beta$ = 1.674
(b) Normal ($\mu$, $\sigma^2$), where $\mu$ = 250 and $\sigma$ = 4.
(c) LogNormal ($\mu$, $\sigma^2$), where $\mu$ = 2.5 and $\sigma$ = 0.4.
(d) Weibull ($\theta$, $\beta$), where $\theta$ = 1.8573 and $\beta$ = 2.674