Ace - AI Tutor
Ask Our Educators
Textbooks
My Library
Flashcards
Scribe - AI Notes
Notes & Exams
Download App
Molly Sheahan

Molly S.

Divider

Questions asked

ANSWERED

Breanna Ollech verified

Numerade educator

Report intercept and slopes for regression equation accurate to 3 decimal places: Intercept: ( a=197.068 ) Partial slope ( X_{1}: b_{1}=2.720 ) Partial slope ( X_{2}: b_{2}=-11.478 ) Report sum of squares accurate to 3 decimal places: [ egin{array}{l} S S_{ ext {reg }}=29876.688 \ S S_{ ext {res }}=5400.235 end{array} ] Test the significance of the overall regression model (report ( F )-ratio accurate to 3 decimal places and ( P )-value accurate to 4 decimal places): [ egin{array}{l} F ext {-ratio }=27.662 \ P ext {-value }=.0001 end{array} ] Report the variance of the residuals accurate to 3 decimal places: [ M S_{ ext {res }}=540.023 ] Report the test statistics for the regression coefficients accurate to 3 decimal places: [ egin{array}{l} t_{1}=3.627 \ t_{2}=square end{array} ]

View Answer
divider
ANSWERED

Ivan Kochetkov verified

Numerade educator

egin{tabular}{|r|r|r|} hline( Y ) & ( X_{1} ) & ( X_{2} ) \ hline 160 & 6 & 49 \ hline 175 & 9 & 53 \ hline 180 & 7 & 38 \ hline 115 & 2 & 28 \ hline 170 & 7 & 49 \ hline 165 & 5 & 48 \ hline 185 & 3 & 31 \ hline 125 & 1 & 24 \ hline 190 & 8 & 50 \ hline 120 & 2 & 33 \ hline end{tabular} Click here to download this data set: Download CSV Determine the following multiple regression values. Report intercept and slopes for regression equation accurate to 3 decimal places: Intercept: ( a=135.783 ) Partial slope ( X_{1}: b_{1}=10.005 ) Partial slope ( X_{2}: b_{2}=-0.678 ) Report sum of squares accurate to 3 decimal places: [ egin{array}{l} S S_{ ext {reg }}=4278.125 \ S S_{ ext {res }}=2824.375 end{array} ] Test the significance of the overall regression model (report ( F )-ratio accurate to 3 decimal places and ( P )-value accurate to 4 decimal places): [ egin{array}{l} F ext {-ratio }=12.118 \ P ext {-value }=.608 end{array} ] Report the variance of the residuals accurate to 3 decimal places: [ M S_{ ext {res }}=353.047 ] Report the results for the hypothesis test for the significance of the partial slope for experience (report the test statistic for the regression coefficients accurate to 3 decimal places and ( P )-value accurate to 4 decimal places): [ t_{1}=1.9010 ] [ P ext {-value }= ]

View Answer
divider
ANSWERED

Jon Southam verified

Numerade educator

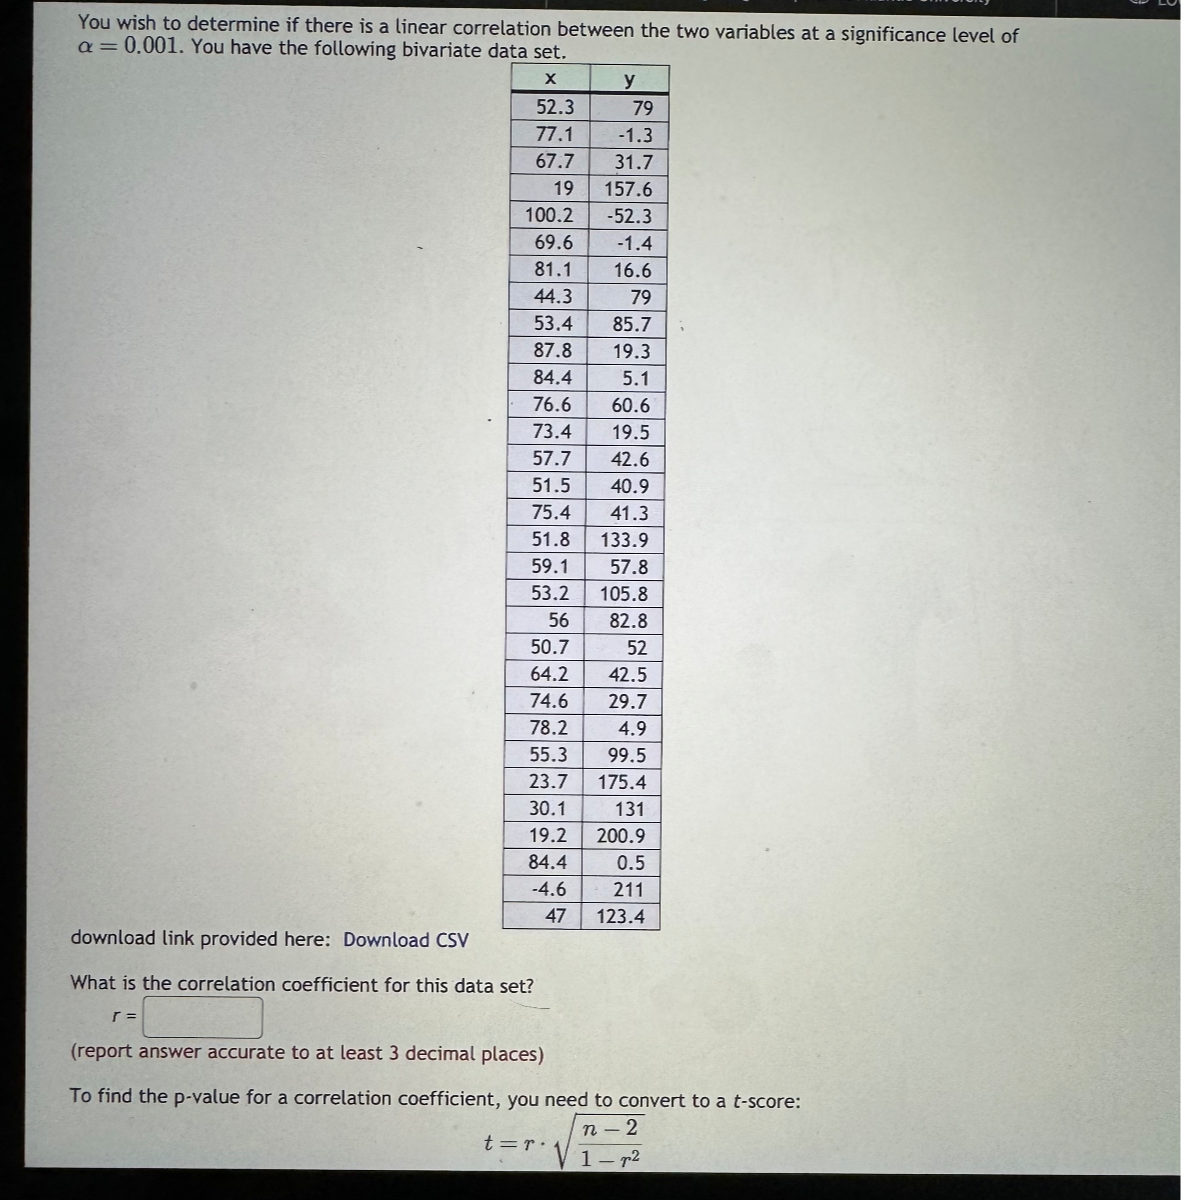
You wish to determine if there is a linear correlation between the two variables at a significance level of ( alpha=0.001 ). You have the following bivariate data set. egin{tabular}{|r|r|} hline multicolumn{1}{|c|}{( mathbf{x} )} & multicolumn{1}{|c|}{( mathbf{y} )} \ hline 52.3 & 79 \ hline 77.1 & -1.3 \ hline 67.7 & 31.7 \ hline 19 & 157.6 \ hline 100.2 & -52.3 \ hline 69.6 & -1.4 \ hline 81.1 & 16.6 \ hline 44.3 & 79 \ hline 53.4 & 85.7 \ hline 87.8 & 19.3 \ hline 84.4 & 5.1 \ hline 76.6 & 60.6 \ hline 73.4 & 19.5 \ hline 57.7 & 42.6 \ hline 51.5 & 40.9 \ hline 75.4 & 41.3 \ hline 51.8 & 133.9 \ hline 59.1 & 57.8 \ hline 53.2 & 105.8 \ hline 56 & 82.8 \ hline 50.7 & 52 \ hline 64.2 & 42.5 \ hline 74.6 & 29.7 \ hline 78.2 & 4.9 \ hline 55.3 & 99.5 \ hline 23.7 & 175.4 \ hline 30.1 & 131 \ hline 19.2 & 200.9 \ hline 84.4 & 0.5 \ hline-4.6 & 211 \ hline 47 & 123.4 \ hline & \ hline end{tabular} download link provided here: Download CSV What is the correlation coefficient for this data set? [ r= ] (report answer accurate to at least 3 decimal places) To find the ( p )-value for a correlation coefficient, you need to convert to a ( t )-score: [ t=r cdot sqrt{frac{n-2}{1-r^{2}}} ]

View Answer
divider
ANSWERED

Danielle Fairburn verified

Numerade educator

A researcher would like to predict the dependent variable ( Y ) from the two independent variables ( X_{1} ) and ( X_{2} ) for a sample of ( N=18 ) subjects. Use multiple linear regression to calculate the coefficient of multiple determination and test the significance of the overall regression model. Use a significance level ( alpha=0.02 ). egin{tabular}{|r|r|r|} hline( X_{1} ) & multicolumn{1}{|c|}{( X_{2} )} & multicolumn{1}{|c|}{( Y )} \ hline 56.2 & 64.5 & 54.8 \ hline 64 & 61.6 & 46.6 \ hline 49.1 & 62.3 & 72.5 \ hline 46.3 & 79.8 & 90.4 \ hline 47.8 & 75.6 & 106.1 \ hline 64.8 & 42.8 & 47 \ hline 71.3 & 48.8 & 61.5 \ hline 66.6 & 55 & 50.9 \ hline 65.2 & 13.2 & 57.2 \ hline 59.1 & 50.6 & 64.8 \ hline 59.5 & 36.3 & 57.1 \ hline 67.3 & 33 & 33.1 \ hline 63.1 & 59 & 55.5 \ hline 54.7 & 66.4 & 77.5 \ hline 67.3 & 50.8 & 39.3 \ hline 58.9 & 41.7 & 56 \ hline 67.3 & 60 & 76.3 \ hline 57.1 & 53 & 72.6 \ hline end{tabular} This data can be downloaded with this link: Download CSV [ egin{array}{l} S S_{ ext {reg }}=square \ S S_{ ext {res }}=square \ R^{2}=square \ F=square \ P ext {-value }=square end{array} ] ( P )-value ( = ) What is your decision for the hypothesis test? Reject the null hypothesis, ( H_{0}: eta_{1}=eta_{2}=0 ) Fail to reject ( H_{0} ) What is your final conclusion? The evidence supports the claim that one or more of the regression coefficients is non-zero The evidence supports the claim that all of the regression coefficients are zero

View Answer
divider
ANSWERED

Tim Thornhill verified

Numerade educator

Based on the data shown below, calculate the regression line (each value to at least two decimal places) [ y=square x+square ] egin{tabular}{|r|r|} hline( x ) & multicolumn{1}{|c|}{( y )} \ hline 5 & 17.9 \ hline 6 & 20.48 \ hline 7 & 23.86 \ hline 8 & 28.04 \ hline 9 & 27.92 \ hline 10 & 31.1 \ hline 11 & 37.08 \ hline 12 & 38.96 \ hline 13 & 40.14 \ hline 14 & 44.52 \ hline 15 & 49.4 \ hline 16 & 51.28 \ hline 17 & 52.16 \ hline 18 & 54.74 \ hline 19 & 57.82 \ hline end{tabular}

View Answer
divider
ANSWERED

Gregory Higby verified

Numerade educator

Here is a scatter plot for a set of bivariate data. What would you estimate the correlation coefficient to be? -0.9 -0.6 0 0.6 0.9

View Answer
divider
ANSWERED

Gregory Higby verified

Numerade educator

Match each scatterplot shown below with one of the four specified correlations. a. -1.00 b. 0.73 c. -0.30 d. 0.37

View Answer
divider
ANSWERED

William Semus verified

Numerade educator

The following is data for the first and second Quiz scores for 8 students in a class. egin{tabular}{|r|r|} hline First Quiz & Second Quiz \ hline 16 & 13 \ hline 20 & 21 \ hline 27 & 23 \ hline 28 & 25 \ hline 34 & 30 \ hline 36 & 32 \ hline 38 & 34 \ hline 45 & 45 \ hline end{tabular} Plot the points in the grid below. Clear All Draw: Dot Predict the value of the second quiz score if a student had a score of 18 on the first test. ( square )

View Answer
divider
ANSWERED

Tim Thornhill verified

Numerade educator

Here is a bivariate data set. egin{tabular}{|r|r|} hline multicolumn{1}{|c|}{( oldsymbol{x} )} & multicolumn{1}{c|}{( oldsymbol{y} )} \ hline 52.2 & -43.9 \ hline 55.8 & -37.1 \ hline 88.8 & 107 \ hline 60.9 & 59.7 \ hline 69.2 & -81.2 \ hline 30.9 & -17 \ hline 76.7 & -7.6 \ hline 45 & -26.5 \ hline 59.4 & -15.8 \ hline 60.7 & 80.2 \ hline 67.9 & 45.2 \ hline 80.6 & 85.5 \ hline 65.1 & -10.7 \ hline 53.9 & 55.6 \ hline end{tabular} Find the correlation coefficient and report it accurate to three decimal places. [ r= ]

View Answer
divider
ANSWERED

Here is a bivariate data set. Find the regression equation for the response variable y. x | y 78.1 | 65 82.2 | 116.2 82.9 | 82.9 75.8 | 91.4 75.9 | 32.2 77.4 | 83.3 72.6 | 76 88.2 | 72 74.4 | 71.3 80.8 | 87.5 77.4 | 83.3 76.4 | 88.5 78 | 67.4 80.8 | 63.6 78.8 | 95.2 82.8 | 89.1 This dataset can be downloaded as a *.csv file with this link: Download CSV regression equation: Enter the equation in slope-intercept form with parameters accurate to three decimal places.

View Answer
divider