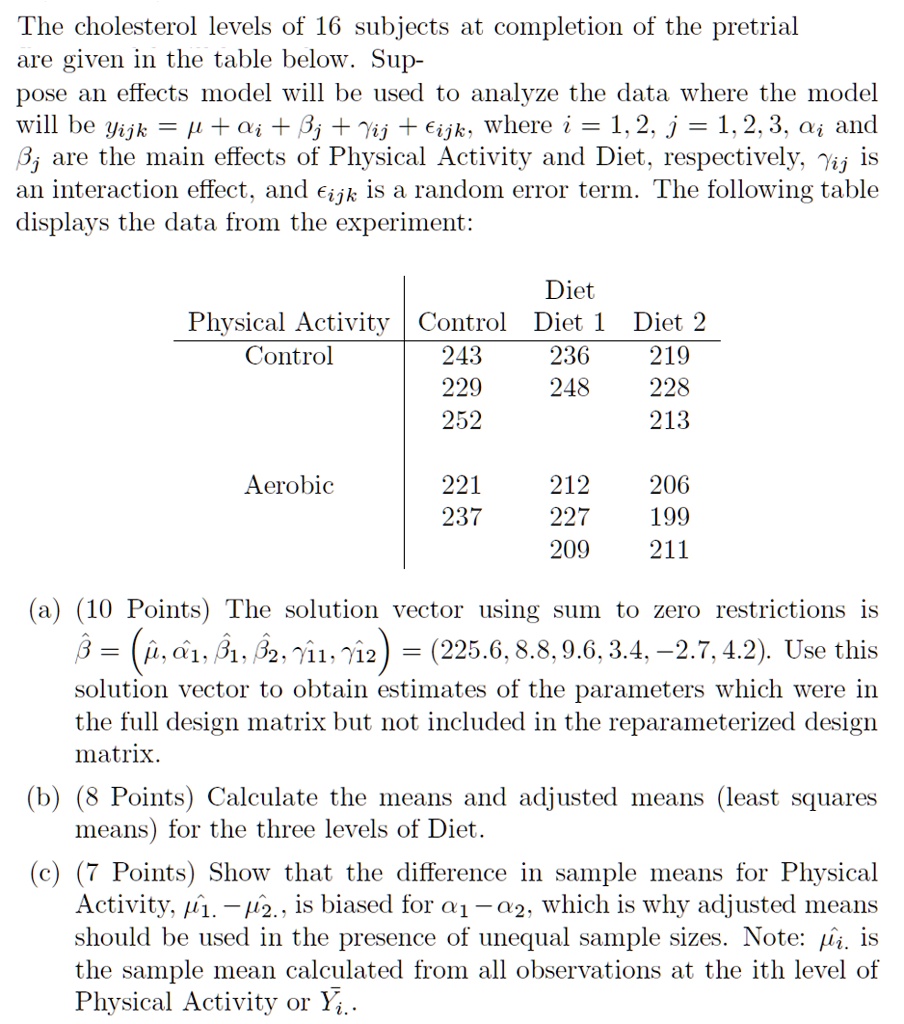
The cholesterol levels of 16 subjects at completion of the pretrial are given in the table below. Suppose an effects model will be used to analyze the data where the model will be yijk = αi + βj + γij + eijk, where i = 1,2, j = 1,2,3, αi and βj represent main effects, γij represents an interaction effect, and eijk is a random error term. The following table displays the data from the experiment:
| Diet | Control | Diet 1 | Diet 2 |
|------|---------|--------|--------|
| 243 | 236 | 219 | 229 |
| 248 | 228 | 252 | 213 |
| | | | |
| Physical Activity | Control | Aerobic |
| 221 | 237 | |
| 212 | 227 | 209 |
| 206 | 199 | 211 |
(a) (10 Points) The solution vector using sum to zero restrictions is β = (α, α1, β1, β2, γ11, γ12) = (225.6, 8.8, 9.6, 3.4, -2.7, 4.2). Use this solution vector to obtain estimates of the parameters which were in the full design matrix but not included in the reparameterized design matrix.
(b) (8 Points) Calculate the means and adjusted means (least squares means) for the three levels of Diet.
(c) (7 Points) Show that the difference in sample means for Physical Activity, 1-2, is biased for α1 - α2, which is why adjusted means should be used in the presence of unequal sample sizes. Note: αi is the sample mean calculated from all observations at the ith level of Physical Activity or Yi.