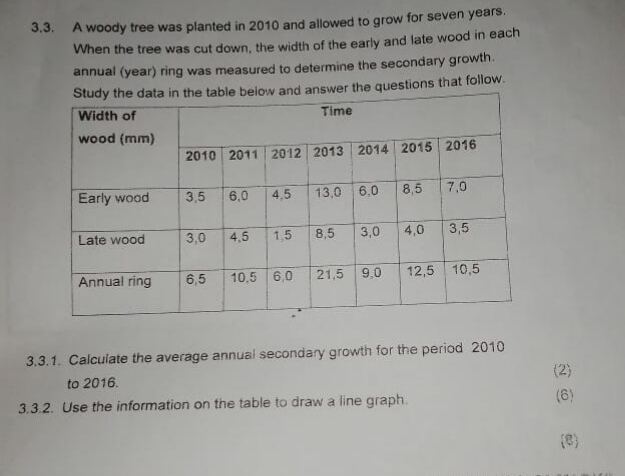
3.3. A woody tree was planted in 2010 and allowed to grow for seven years. When the tree was cut down, the width of the early and late wood in each annual (year) ring was measured to determine the secondary growth. Study the data in the table below and answer the questions that follow.
Width of wood (mm) | Time | | | | | |
--- | --- | --- | --- | --- | --- | --- | ---
| 2010 | 2011 | 2012 | 2013 | 2014 | 2015 | 2016
Early wood | 3,5 | 6,0 | 4,5 | 13,0 | 6,0 | 8,5 | 7,0
Late wood | 3,0 | 4,5 | 1,5 | 8,5 | 3,0 | 4,0 | 3,5
Annual ring | 6,5 | 10,5 | 6,0 | 21,5 | 9,0 | 12,5 | 10,5
3.3.1. Calculate the average annual secondary growth for the period 2010 to 2016. (2)
3.3.2. Use the information on the table to draw a line graph. (6)