Ace - AI Tutor
Ask Our Educators
Textbooks
My Library
Flashcards
Scribe - AI Notes
Notes & Exams
Download App
natalie doyle

natalie d.

Divider

Questions asked

BEST MATCH

Question 3 (2 points) Warranty expense should be recorded: in the future period when the product is repaired or replaced in the future period when the accounts receivable from the sale is collected in the future period when the cost of repairing the product is paid in the period when the product is sold

View Answer
divider
BEST MATCH

Question 8 (3.7 points) Saved 1 minute question Why is the regeneration of NAD+ essential in anaerobic glycolysis? It is needed for the oxidative phosphorylation in mitochondria. NAD+ is necessary for the formation of pyruvate from lactate. It is not essential; glycolysis can proceed without NAD+ regeneration. Without NAD+, glycolysis would halt as NAD+ is required for glyceraldehyde-3- phosphate dehydrogenase.

View Answer
divider
BEST MATCH

When Canadian dollar appreciates would Canadian exports to US increase or decrease? Explain why using at least 100 words

View Answer
divider
BEST MATCH

G(ej?) x[n] ? L H(ej?) ?M y[n] (a) System A xc(t) C/D G(ej?) D/C yc(t) T1 (b) System B T2 Figure 1 X(ej?) -? -?0 0 ?0 ? Figure 2

View Answer
divider
BEST MATCH

Part a Subgroup x1 x x3 x4 459 449 435 450 443 440 442 442 457 444 449 444 469 463 453 438 443 457 445 454 Part c Subgroup x1 x2 x3 24 21 454 449 443 461 22 449 441 444 455 23 442 442 442 450 24 410 438 437 438 25 446 459 457 457 26 454 448 445 462 27 458 449 453 438 28 450 449 445 451 29 443 440 443 451 30 457 450 452 437 A titanium-tungsten layer is deposited on a substrate using a sputtering tool. Layer thickness measurements (in angstroms) on subgroups of four substrates are collected for quality control purposes. 444 456 457 445 452 and s control charts using this data. Compute the centerline and control limits suitable for monitoring future production. b)[2 points] Are there any nonrandom patterns in either of the two charts? (c) [3 points] Part C Data contains 10 new subgroups of thickness data taken after the initial control charts were established. Plot this new data on the control charts 444 452 440 463 463 438 447 441 465 450 computed in part (a) based on the new data. (d) [5 points] Which points (if any) plot out-of-control on the control charts constructed in part (c)? Explain which of the following is a likely explanation for any out-of-control signals: shift in the process mean vs. individual outlier measurements. 460 453 438 435 450 457 438 430 444 446 448 454

View Answer
divider
BEST MATCH

2. (20 Points) Draw the Bode Plot for the following system \begin{equation} G(s) = \frac{1000}{s(s+5)(s+20)} \end{equation} Do not use MATLAB. Show the necessary steps to obtain the plot. Compute Gain and Phase Margin.

View Answer
divider
BEST MATCH

52 Given register X0=9000, X1=0, and memory location 9064=182 What is the result of the following ARM instruction? LDUR X1, [X0, #64] X0=0, X1=9000, memory location 9064=182 X0=0, X1=182, memory location 9064=9000 Results in an error X0=9000, X1=182, memory location 9064=182

View Answer
divider
BEST MATCH

4. A round rotor generator delivers steady state power $P_e = 0.5$ p.u. to an infinite bus through a transmission line with $X_l = 0.4$ p.u. $|E_g| = 1.8$ p.u., $V_\infty = 1.0\angle 0$ p.u., $H = 5$ sec, $X_d = X_q = 1.0$ p.u. Neglect resistances. The generator experiences a bolted three phase fault at its terminals. Circuit breakers open to clear the fault, then successfully reclose six cycles (0.1 sec) later. Find the maximum value of the generator rotor angle $\delta$. Neglect damping. Sketch the areas.

View Answer
divider
BEST MATCH

class graph { int num; int **adj; public: graph (int n){ num = n; adj = new int*[num]; for (int i=0; i<num; i++) adj[i] = new int[num]; for (int i=0; i<num; i++) for (int j=0; j<num; j++) adj[i][j] = 0; }

View Answer
divider
BEST MATCH

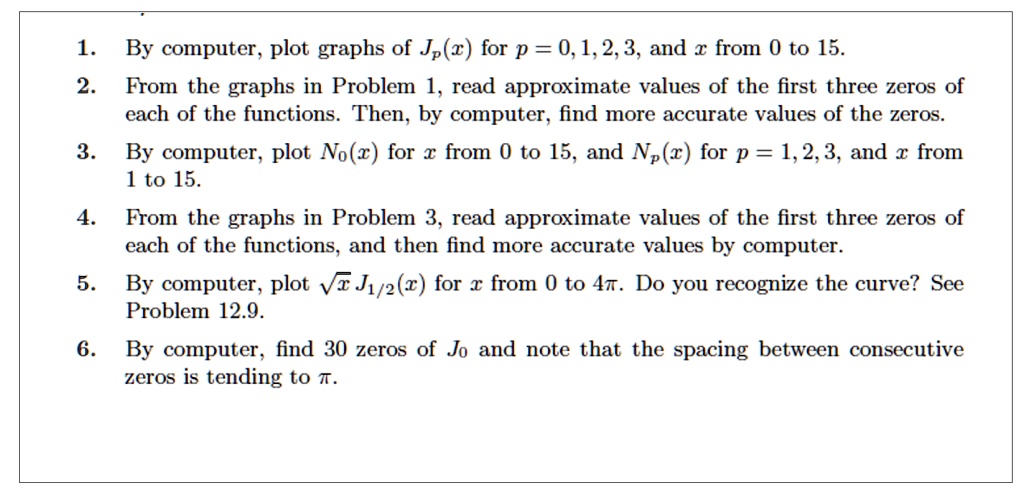
1. By computer, plot graphs of $J_p(x)$ for $p = 0, 1, 2, 3$, and $x$ from 0 to 15. 2. From the graphs in Problem 1, read approximate values of the first three zeros of each of the functions. Then, by computer, find more accurate values of the zeros. 3. By computer, plot $N_0(x)$ for $x$ from 0 to 15, and $N_p(x)$ for $p = 1, 2, 3$, and $x$ from 1 to 15. 4. From the graphs in Problem 3, read approximate values of the first three zeros of each of the functions, and then find more accurate values by computer. 5. By computer, plot $\sqrt{x}J_{1/2}(x)$ for $x$ from 0 to $4\pi$. Do you recognize the curve? See Problem 12.9. 6. By computer, find 30 zeros of $J_0$ and note that the spacing between consecutive zeros is tending to $\pi$.
View Answer
divider