Q2)-
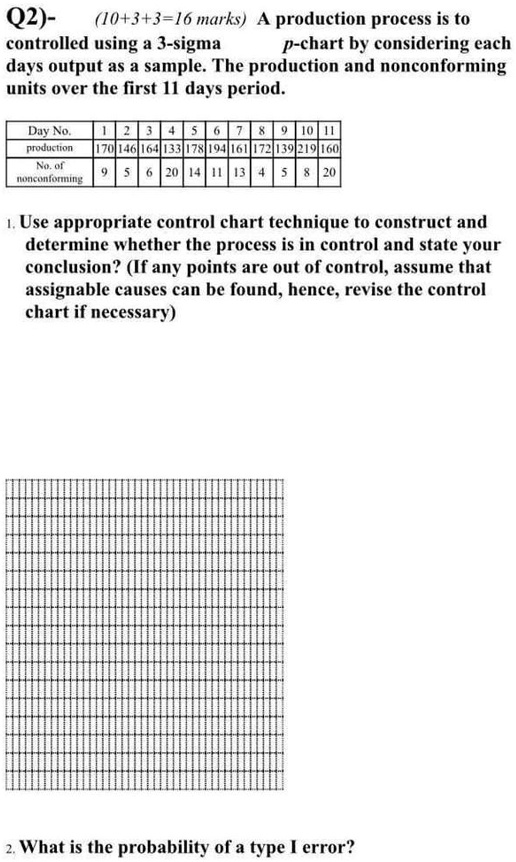
(10+3+3=16 marks) A production process is to
controlled using a 3-sigma $p$-chart by considering each
days output as a sample. The production and nonconforming
units over the first 11 days period.
Day No.
production
No. of
nonconforming
1 2 3 4 5 6 7 8 9 10 11
170 146 164 133 178 194 161 172 139 219 160
9 5 6 20 14 11 13 4 5 8 20
1. Use appropriate control chart technique to construct and
determine whether the process is in control and state your
conclusion? (If any points are out of control, assume that
assignable causes can be found, hence, revise the control
chart if necessary)
2. What is the probability of a type I error?