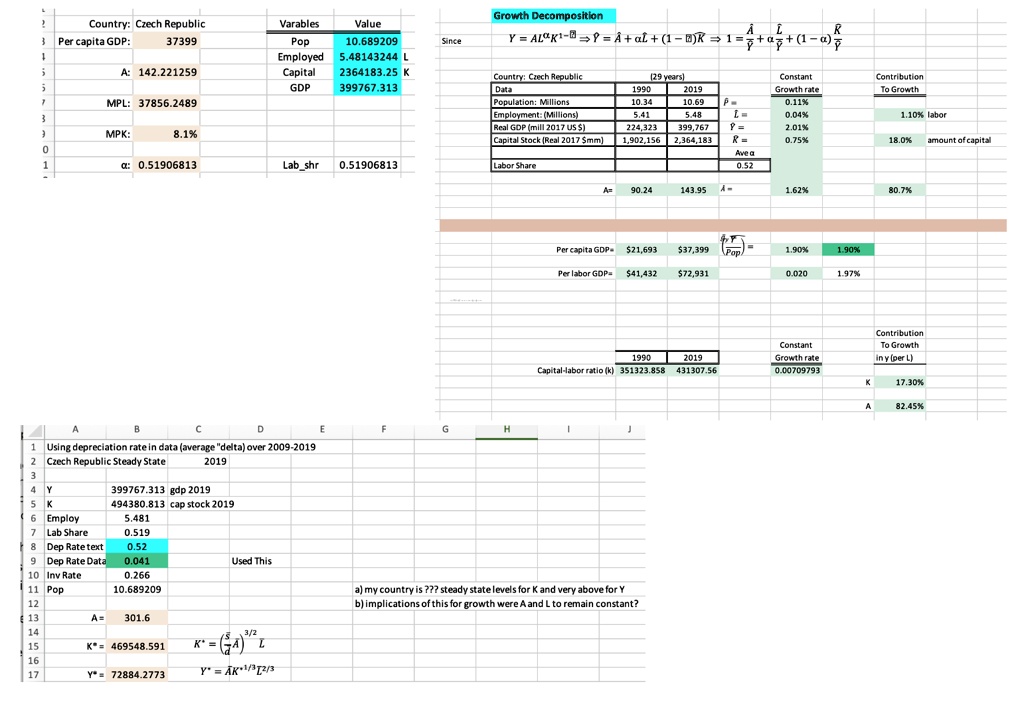
Using the Penn World Data table for the Czech Republic. You may also see the attached image for help.
1) Contrast the level and the growth rate of "A" with that of the US. Discuss factors that may explain differences or similarities noted. Briefly assess how some elements of the social, political, legal, tax, educational, and cultural environments may inhibit or promote long-term growth in living standards.
Country: Czech Republic
Per capita GDP: 37399
A: 142.22125957
MPL: 37856.24893
MPK: 8.10%
Growth Decomposition
Variables Value
Pop 10.689209
Employed 5.48143244
Capital 2364183.25
GDP 399767.313
A K Since
Country: Czech Republic
Data
Population: Millions
Employment: (Millions)
Real GDP (mill 2017 US $)
Capital Stock (Real 2017 $mm)
(29 years)
1990 2019
10.34 10.69
P = 5.41 5.48
L = 224,323 399,767
= 1,902,156 2,364,183
R = Avea 0.52
Constant Growth rate
0.11% 0.04% 2.01% 0.75%
Contribution To Growth
1.10% labor
18.0% amount of capital
Lab_shr 0.51906813
Labor Share
A= 90.24 143.95
A= 1.62% 80.7%
Per capita GDP $21,693
Y $37,399 (Pop)
1.90% 1.90%
Per labor GDP= $41,432
$72,931
0.020 1.97%
Contribution To Growth in y (per L)
Constant Growth rate 0.00709793
1990 2019
Capital-labor ratio(k) 351323.858 431307.56
17.30% 82.45%
A B C D H
Using depreciation rate in data (average delta over 2009-2019 2 Czech Republic Steady State 2019
399767.313 gdp 2019
K 494380.813 cap stock 2019
Employ 5.481
Lab Share 0.519
Dep Rate text 0.52
Dep Rate Data 0.041
Used This 10
Inv Rate 0.266
Pop 10.689209
A= 301.6
K*= 469548.591
K=A
y*= 72884.2773
Y=AK1/32/3
a) my country is??? steady state levels for K and very above for Y
b) implications of this for growth were A and L to remain constant?