3. Graphing the saving and consumption functions from the MPC
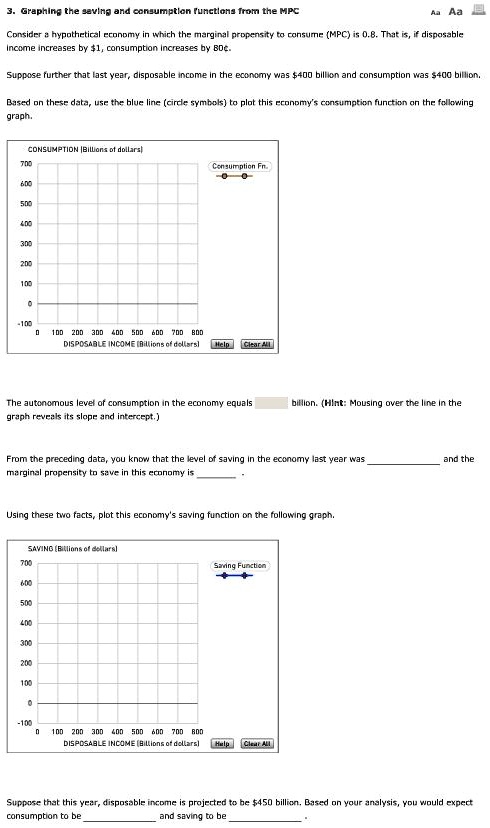
Consider a hypothetical economy in which the marginal propensity to consume (MPC) is 0.8. That is, if disposable
income increases by $1, consumption increases by 80¢.
Suppose further that last year, disposable income in the economy was $400 billion and consumption was $400 billion.
Based on these data, use the blue line (circle symbols) to plot this economy's consumption function on the following
graph.
CONSUMPTION (Billions of dollars)
700
Consumption Fn.
600
500
400
300
200
100
0
-100
0 100 200 300 400 500 600 700 800
DISPOSABLE INCOME (Billions of dollars)
Help
Clear All
The autonomous level of consumption in the economy equals
billion. (Hint: Mousing over the line in the
graph reveals its slope and intercept.)
From the preceding data, you know that the level of saving in the economy last year was
and the
marginal propensity to save in this economy is
Using these two facts, plot this economy's saving function on the following graph.
SAVING (Billions of dollars)
700
600
500
400
300
200
100
0
-100
0 100 200 300 400 500 600 700 800
DISPOSABLE INCOME (Billions of dollars)
Saving Function
Help
Clear All
Suppose that this year, disposable income is projected to be $450 billion. Based on your analysis, you would expect
consumption to be
and saving to be