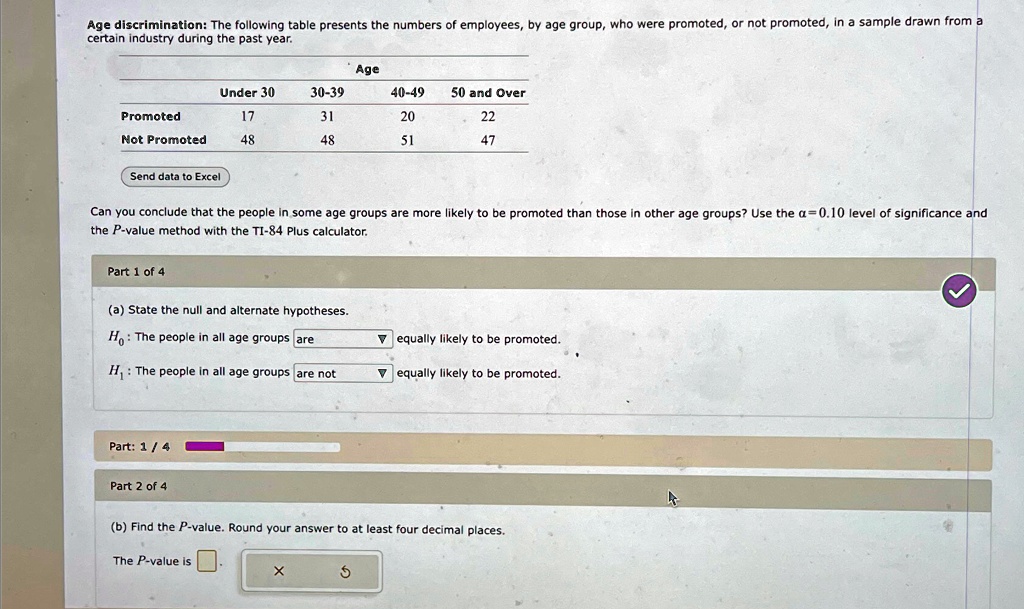
Age discrimination: The following table presents the numbers of employees, by age group, who were promoted, or not promoted, in a sample drawn from a
certain industry during the past year.
Age
Under 30
30-39
40-49
50 and Over
Promoted
17
31
20
22
Not Promoted
48
48
51
47
Send data to Excel
Can you conclude that the people in some age groups are more likely to be promoted than those in other age groups? Use the $\alpha = 0.10$ level of significance and
the P-value method with the TI-84 Plus calculator.
Part 1 of 4
(a) State the null and alternate hypotheses.
$H_0$: The people in all age groups are
$\blacktriangle$ equally likely to be promoted.
$H_1$: The people in all age groups are not
$\blacktriangle$ equally likely to be promoted.
Part: 1 / 4
Part 2 of 4
(b) Find the P-value. Round your answer to at least four decimal places.
The P-value is
X
5