bb.pearsonemg.com
Do Homework
Homework
Homework
dent/integratedAssignmentOverview.aspx?homeworkld=676705451
lanage (4)
Zahra Al-Rabley 11/05/24 9:52 PM
ework
Question
Part 2 of 2
Completed: 4 of 7 | My scores 30/50 pts (60\%)
Savo
Q
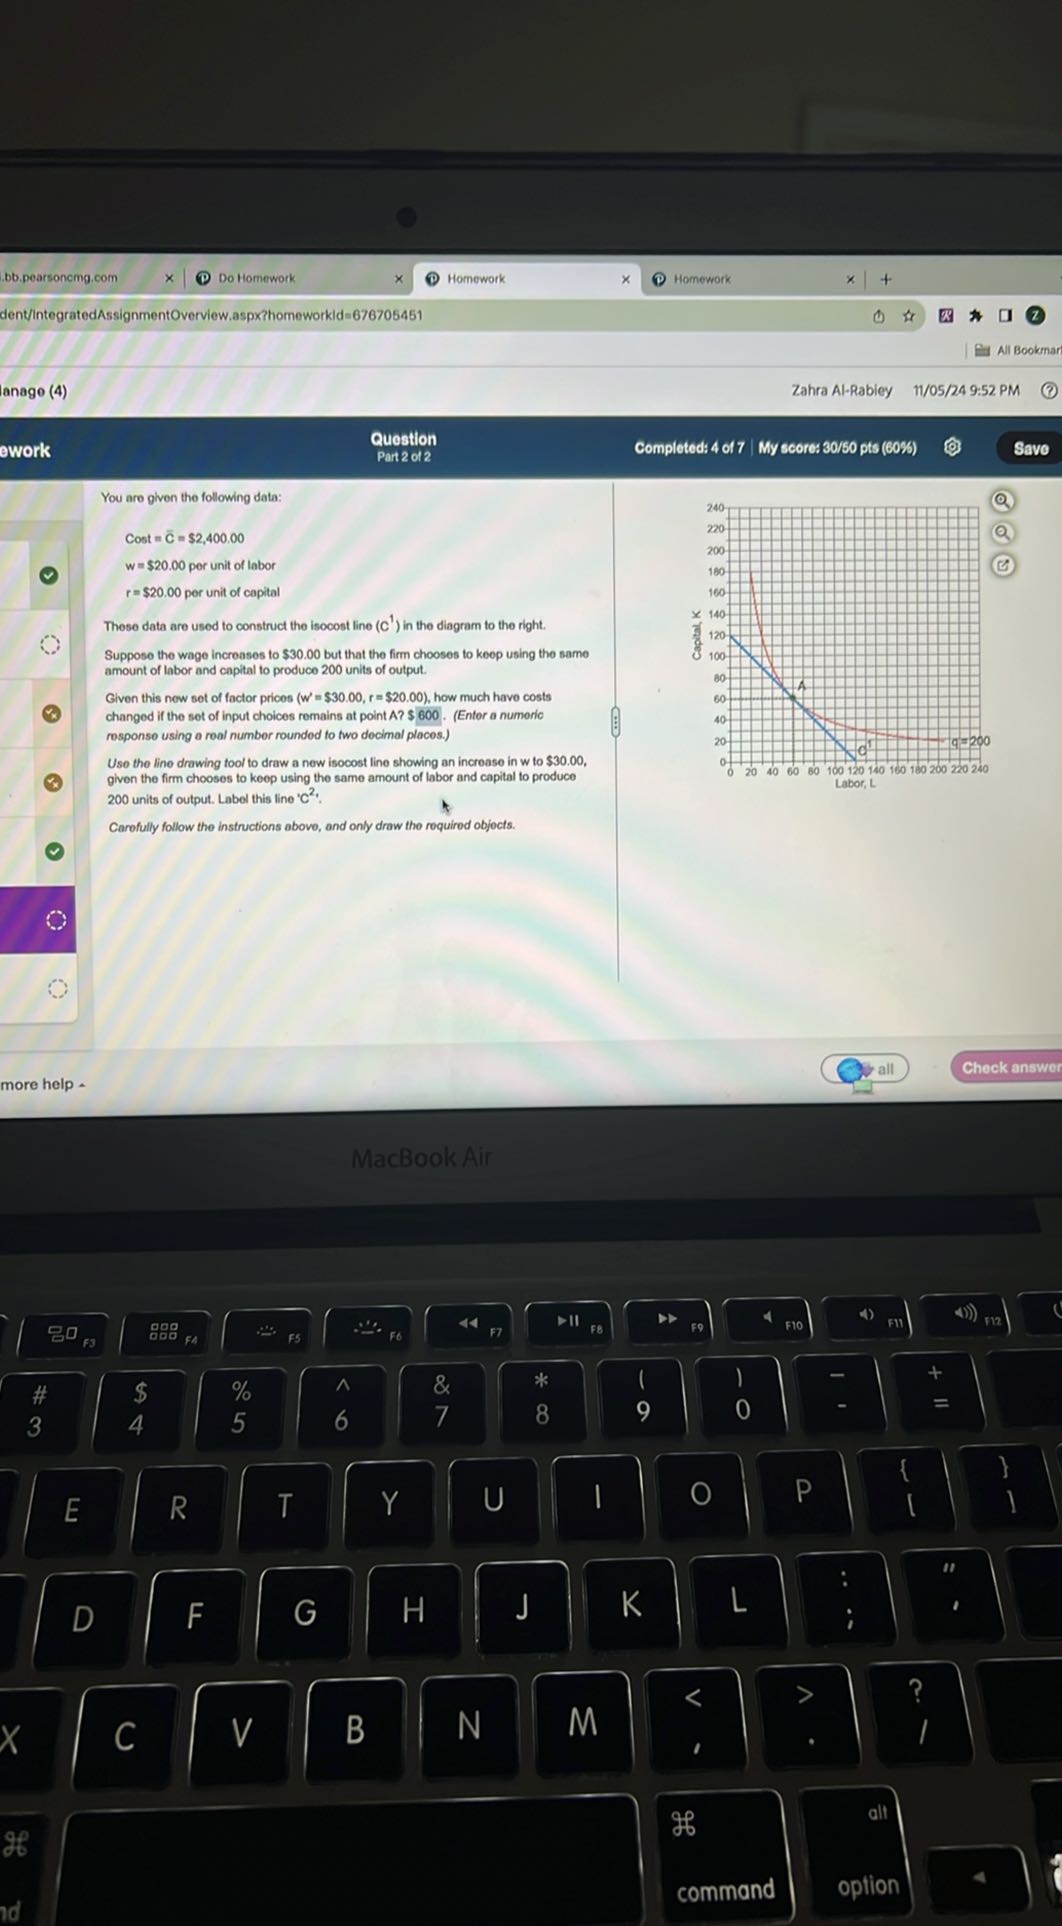
You are given the following data:
\[
\begin{array}{l}
\text { Cost }=\overline{\mathrm{C}}=\$ 2,400.00 \\
w=\$ 20.00 \text { per unit of tabor } \\
r=\$ 20.00 \text { per unit of capital }
\end{array}
\]
These data are used to construct the isocost line \( \left(C^{1}\right) \) in the diagram to the right.
Suppose the wage increases to \( \$ 30.00 \) but that the firm chooses to keep using the same amount of labor and capital to produce 200 units of output.
Given this now set of factor prices ( \( w=\$ 30.00, r=\$ 20.00 \) ), how much have costs changed if the set of input choices remains at point \( A \) ? \( \$ 600 \). (Entor a numeric responso using a real number rounded to two docimal places.)
Use the line drawing tool to draw a new isocost line showing an incroase in w to \( \$ 30.00 \), given the firm chooses to keop using the same amount of labor and capital to produce 200 units of output. Label this line \( { }^{\prime} \mathrm{C}^{2} \) !
9
9
(C)
240
more help -
Check answer
Carefully follow the instructions above, and only draw the requirod objocts.