Please calculate the ones in yellow and give me the answers.
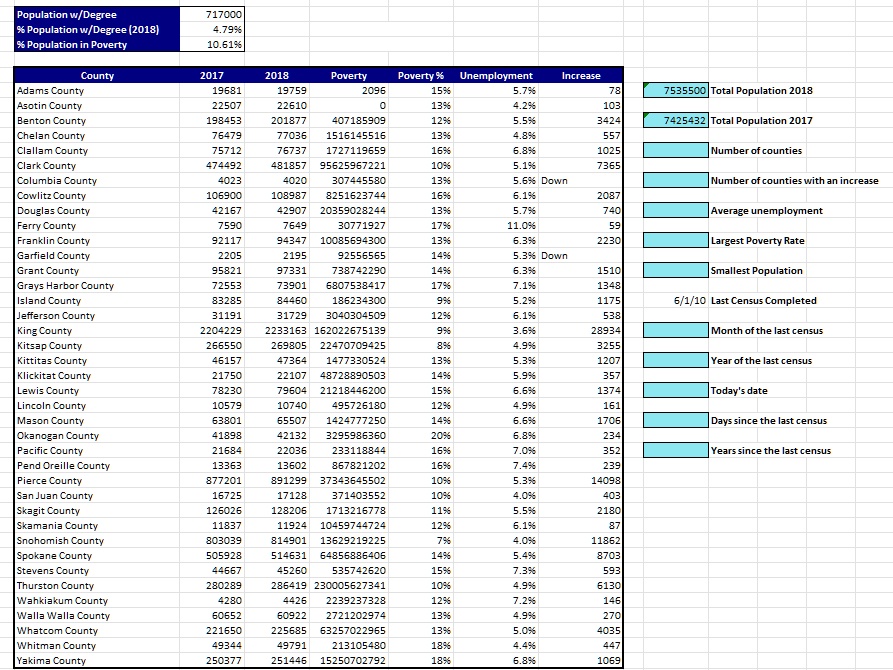
Population w/Degree % Population w/Degree (2018) % Population in Poverty
717,000 4.79% 10.61%
County Adams County Asotin County Benton County Chelan County Clallam County Clark County Columbia County Cowlitz County Douglas County Ferry County Franklin County Garfield County Grant County Grays Harbor County Island County Jefferson County King County Kitsap County Kittitas County Klickitat County Lewis County Lincoln County Mason County Okanogan County Pacific County Pend Oreille County Pierce County San Juan County Skagit County Skamania County Snohomish County Spokane County Stevens County Thurston County Wahkiakum County Walla Walla County Whatcom County Whitman County Yakima County
2017 19,681 22,507 198,453 76,479 75,712 474,492 4,023 106,900 42,167 7,590 92,117 2,205 95,821 72,553 83,285 31,191 2,204,229 266,550 46,157 21,750 78,230 10,579 63,801 41,898 21,684 13,363 877,201 16,725 126,026 11,837 6E0E08 505,928 44,667 280,289 4,280 60,652 221,650 49,344 250,377
2018 Poverty Poverty % Unemployment Increase 19,759 2,096 15% 5.7% 78 22,610 13% 4.2% 103 201,877 407,185,909 12% 5.5% 3,424 77,036 1,516,145,516 13% 4.8% 557 76,737 1,727,119,659 16% 6.8% 1,025 481,857 956,259,672,210 10% 5.1% 7,365 4,020 307,445,580 13% 5.6% Down 108,987 8,251,623,744 16% 6.1% 2,087 42,907 20,359,028,244 13% 5.7% 740 7,649 30,771,927 17% 11.0% 59 94,347 10,085,694,300 13% 6.3% 2,230 2,195 92,556,565 14% 5.3% Down 97,331 738,742,290 14% 6.3% 1,510 73,901 6,807,538,417 17% 7.1% 1,348 84,460 186,234,300 9% 5.2% 1,175 31,729 3,040,304,509 12% 6.1% 538 223,316,316,202,267,513,9 9% 3.6% 28,934 269,805 22,470,709,425 8% 4.9% 3,255 47,364 1,477,330,524 13% 5.3% 1,207 22,107 48,728,890,503 14% 5.9% 357 79,604 21,218,446,200 15% 6.6% 1,374 10,740 495,726,180 12% 4.9% 161 65,507 1,424,777,250 14% 6.6% 1,706 42,132 3,295,986,360 20% 6.8% 234 22,036 233,118,844 16% 7.0% 352 13,602 867,821,202 16% 7.4% 239 891,299 37,343,645,502 10% 5.3% 14,098 17,128 371,403,552 10% 4.0% 403 128,206 1,713,216,778 11% 5.5% 2,180 11,924 10,459,744,724 12% 6.1% 87 814,901 13,629,219,225 7% 4.0% 11,862 514,631 64,856,886,406 14% 5.4% 8,703 45,260 535,742,620 15% 7.3% E6S 286,419,230,005,627,341 10% 4.9% 6,130 4,426 2,239,237,328 12% 7.2% 146 60,922 2,721,202,974 13% 4.9% 270 225,685 63,257,022,965 13% 5.0% 4,035 49,791 213,105,480 18% 4.4% 447 251,446 15,250,702,792 18% 6.8% 1,069
7,535,500 | Total Population 2018
7,425,432 | Total Population 2017
Number of counties
Number of counties with an increase
Average unemployment
Largest Poverty Rate
Smallest Population
6/1/10 Last Census Completed
Month of the last census
Year of the last census
Today's date
Days since the last census
Years since the last census