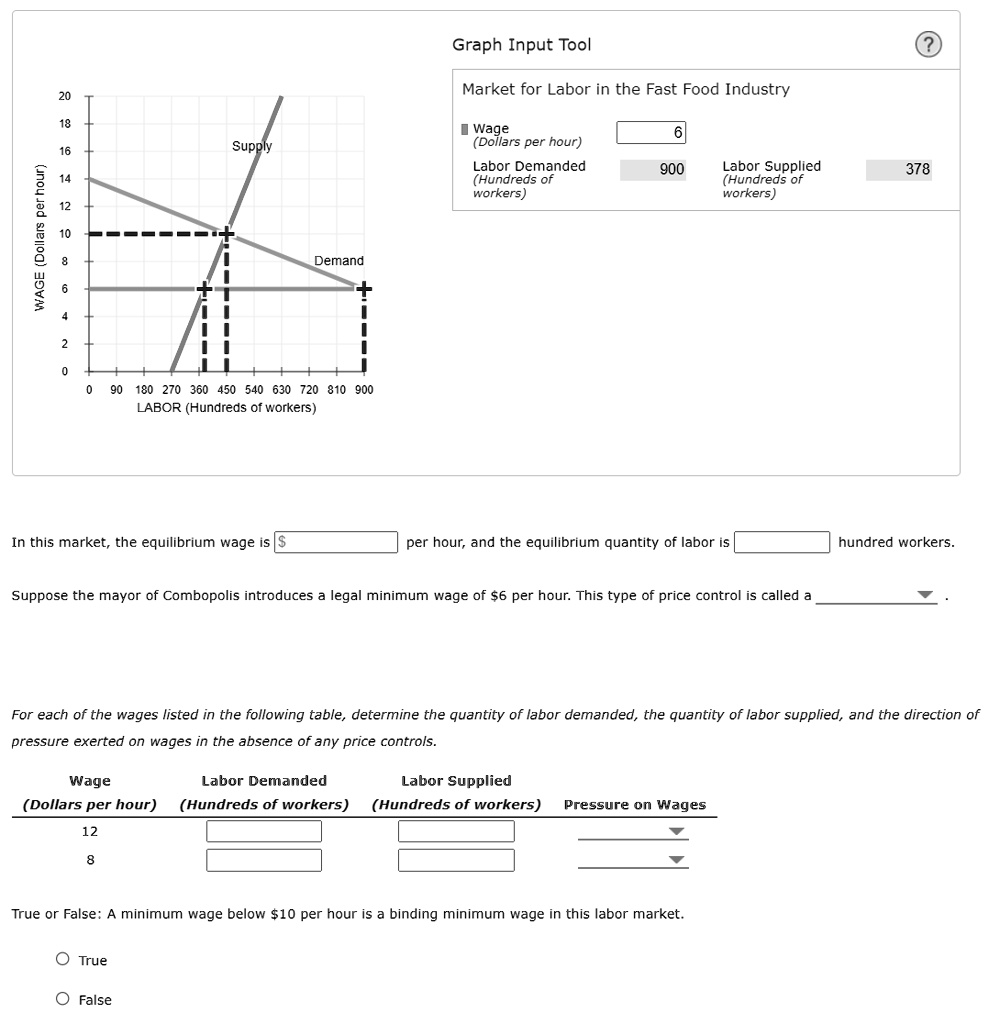
The following graph gives the labor market for the fast-food industry of the imaginary city of Combopolis.For the price control drop box the answer choices are: price floor, price ceiling, quota, or taxFor the pressure drop boxes the answer choices are: Upward or Downward
Graph Input Tool
Market for Labor in the Fast Food Industry
20
18
Wage (Dollars per hour)
6
16 14 2 WAGE (Dollars per hour) 2
Supply
Labor Demanded (Hundreds of workers)
900
Labor Supplied (Hundreds of workers)
378
Demand
0
90180 270 360 450 540 630 720 810 900 LABOR (Hundreds of workers)
In this market, the equilibrium wage is$
per hour, and the equilibrium quantity of labor is
hundred workers
For each of the wages listed in the following table, determine the quantity of labor demanded, the quantity of labor supplied, and the direction of
pressure exerted on wages in the absence of any price controls.
Wage
Labor Demanded
Labor Supplied
(Dollars per hour)
(Hundreds of workers)
(Hundreds of workers)
Pressure on Wages
12
8
True or False: A minimum wage below $1o per hour is a binding minimum wage in this labor market.
Drrr e
O False