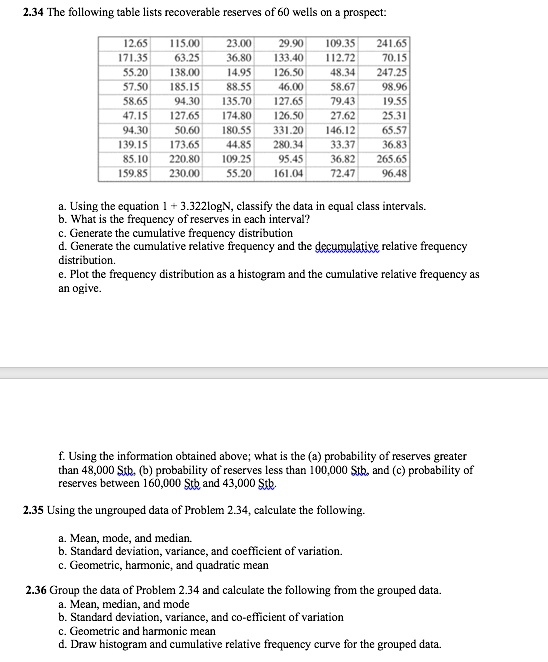
2.34 The following table lists recoverable reserves of 60 wells on a prospect:
12.65 115.00 171.35 63.25 55.20 138.00 57.50 185.15 58.65 94.30 47.15 127.65 94.30 50.60 139.15 173.65 85.10 220.80 159.85 230.00
23.00 36.80 14.95 88.55 135.70 174.80 180.55 44.85 109.25 55.20
29.90 133.40 126.50 46.00 127.65 126.50 331.20 280.34 95.45 161.04
109.35 241.65 112.72 70.15 48.34 247.25 58.67 98.96 79.43 19.55 27.62 25.31 146.12 65.57 33.37 36.83 36.82 265.65 72.47 96.48
a. Using the equation 1 + 3.322logN, classify the data in equal class intervals. b. What is the frequency of reserves in each interval? c. Generate the cumulative frequency distribution d. Generate the cumulative relative frequency and the decumulative relative frequency distribution. e. Plot the frequency distribution as a histogram and the cumulative relative frequency as an ogive.
f. Using the information obtained above; what is the (a) probability of reserves greater than 48,000 Stb, (b) probability of reserves less than 100,000 Stb, and (c) probability of reserves between 160,000 Stb and 43,000 Stb.
2.35 Using the ungrouped data of Problem 2.34, calculate the following.
a. Mean, mode, and median. b. Standard deviation, variance, and coefficient of variation. c. Geometric, harmonic, and quadratic mean
2.36 Group the data of Problem 2.34 and calculate the following from the grouped data a. Mean, median, and mode b. Standard deviation, variance, and coefficient of variation c. Geometric and harmonic mean d. Draw histogram and cumulative relative frequency curve for the grouped data