QUESTION 1
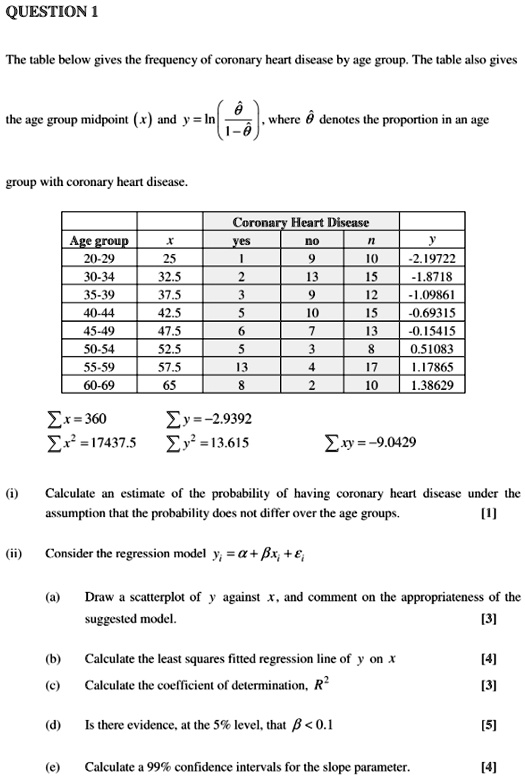
The table below gives the frequency of coronary heart disease by age group. The table also gives
the age group midpoint ($x$) and $y = \ln(\frac{\hat{\theta}}{1-\hat{\theta}})$, where $\hat{\theta}$ denotes the proportion in an age
group with coronary heart disease.
Coronary Heart Disease
Age group x yes no n y
20-29 25 1 9 10 -2.19722
30-34 32.5 2 13 15 -1.8718
35-39 37.5 3 9 12 -1.09861
40-44 42.5 5 10 15 -0.69315
45-49 47.5 6 7 13 -0.15415
50-54 52.5 5 3 8 0.51083
55-59 57.5 13 4 17 1.17865
60-69 65 8 2 10 1.38629
$\sum x = 360$
$\sum y = -2.9392$
$\sum x^2 = 17437.5$
$\sum y^2 = 13.615$
$\sum xy = -9.0429$
(i) Calculate an estimate of the probability of having coronary heart disease under the
assumption that the probability does not differ over the age groups. [1]
(ii) Consider the regression model $y_i = \alpha + \beta x_i + \epsilon_i$
(a) Draw a scatterplot of y against x, and comment on the appropriateness of the
suggested model. [3]
(b) Calculate the least squares fitted regression line of y on x [4]
(c) Calculate the coefficient of determination, $R^2$ [3]
(d) Is there evidence, at the 5% level, that $\beta < 0.1$ [5]
(e) Calculate a 99% confidence intervals for the slope parameter. [4]