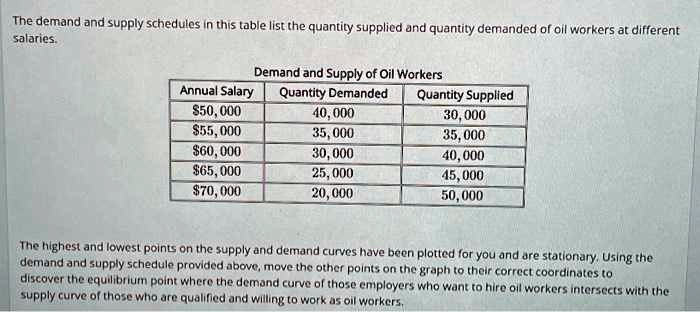
The demand and supply schedules in this table list the quantity supplied and quantity demanded of oil workers at different
salaries.
Demand and Supply of Oil Workers
Annual Salary
Quantity Demanded
Quantity Supplied
$50,000
40,000
30,000
$55,000
35,000
35,000
$60,000
30,000
40,000
$65,000
25,000
45,000
$70,000
20,000
50,000
The highest and lowest points on the supply and demand curves have been plotted for you and are stationary. Using the
demand and supply schedule provided above, move the other points on the graph to their correct coordinates to
discover the equilibrium point where the demand curve of those employers who want to hire oil workers intersects with the
supply curve of those who are qualified and willing to work as oil workers.