QUESTION 13
Price and cost (dollars per ton)
300+
225
150
100
75
0
2
MSC
S = MC
D = MB
6
Quantity (thousands of tons per month)
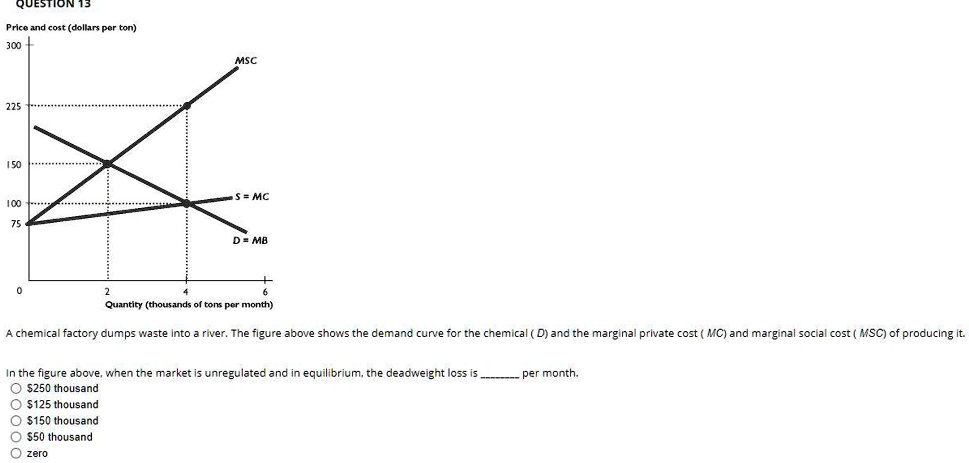
A chemical factory dumps waste into a river. The figure above shows the demand curve for the chemical (D) and the marginal private cost (MC) and marginal social cost (MSC) of producing it.
In the figure above, when the market is unregulated and in equilibrium, the deadweight loss is ____ per month.
$250 thousand
$125 thousand
$150 thousand
$50 thousand
zero