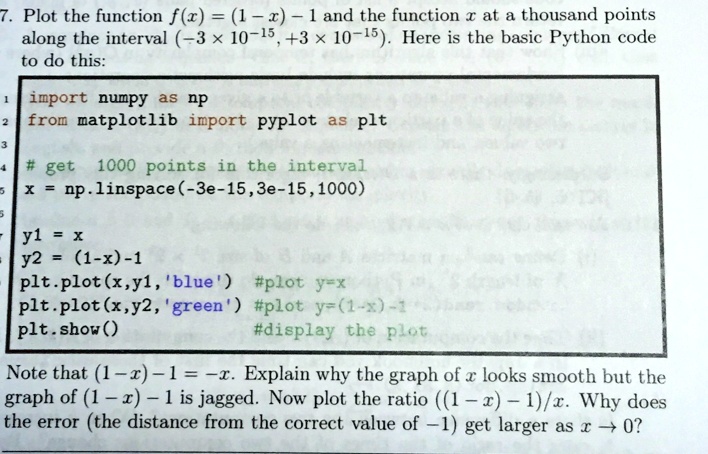
7. Plot the function $f(x) = (1 - x)^{-1}$ and the function $x$ at a thousand points
along the interval $(-3 \times 10^{-15}, +3 \times 10^{-15})$. Here is the basic Python code
to do this:
```python
import numpy as np
from matplotlib import pyplot as plt
# get 1000 points in the interval
x = np.linspace(-3e-15, 3e-15, 1000)
y1 = x
y2 = (1 - x) ** -1
plt.plot(x, y1, 'blue') # plot y = x
plt.plot(x, y2, 'green') # plot y = (1 - x) ** -1
plt.show() # display the plot
```
Note that $(1 - x)^{-1} = -x$. Explain why the graph of $x$ looks smooth but the
graph of $(1 - x)^{-1}$ is jagged. Now plot the ratio $((1 - x)^{-1}) / x$. Why does
the error (the distance from the correct value of $-1$) get larger as $x \to 0$?