/Student/PlayerHomework.aspx?homeworkId=677956305&questionId=1&flushed=false&cid=7903990&back=DoAssignments.aspx...?
?
Finish update:
All Bookmarks
Adan Longoria
HW Score: 57.78%, 8.67 of 15 points
Points: 0 of 1
Save
mency Distributions and
Question 10, 2.1.30
Part 2 of 8
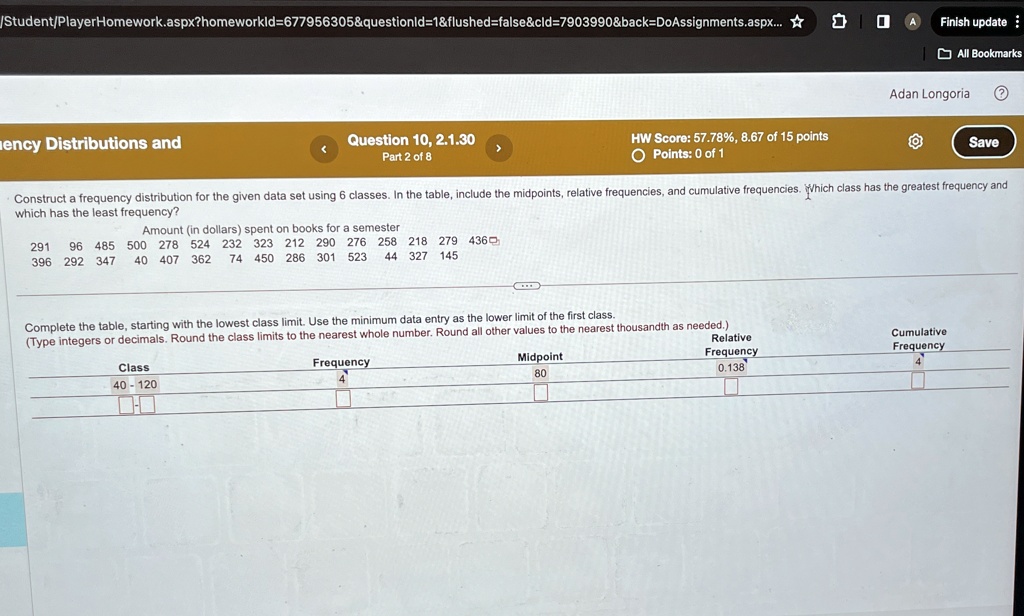
Construct a frequency distribution for the given data set using 6 classes. In the table, include the midpoints, relative frequencies, and cumulative frequencies. Which class has the greatest frequency and
which has the least frequency?
Amount (in dollars) spent on books for a semester
291 96 485 500 278 524 232 323 212 290 276 258 218 279 436
396 292 347 40 407 362 74 450 286 301 523 44 327 145
Complete the table, starting with the lowest class limit. Use the minimum data entry as the lower limit of the first class.
(Type integers or decimals. Round the class limits to the nearest whole number. Round all other values to the nearest thousandth as needed.)
Class
40 - 120
Frequency
4
Midpoint
80
Relative
Frequency
0.138
Cumulative
Frequency
4