PRICE (Dollars per an)
Allar Tan
Demand
200
180
160
140
120
100
80
60
40
20
0
Tax Revenue
Tax Wedge
Consumer Surplus
Supply
Producer Surplus
0 10 20 30 40 50 60 70 80 90 100
QUANTITY (Fans)
Deadweight Loss
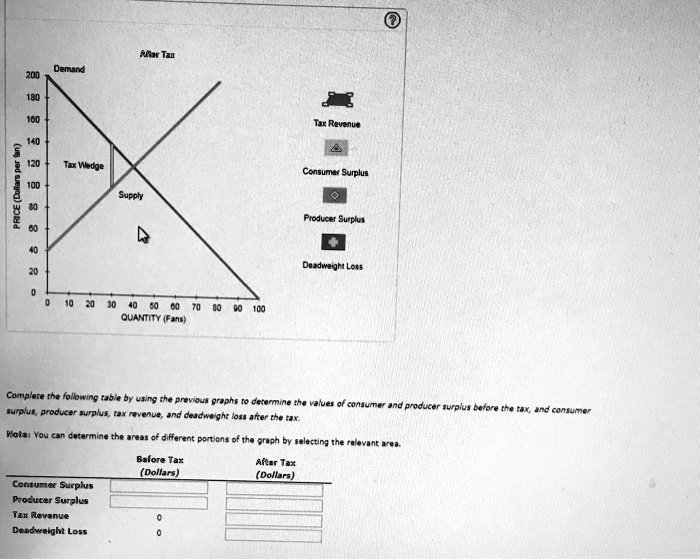
Complete the following table by using the previous graphs to determine the values of consumer and producer surplus before the tax, and consumer
surplus, producer surplus, tax revenue, and deadweight loss after the tax.
Plats: You can determine the areas of different portions of the graph by selecting the relevant area.
Before Tax
(Dollars)
Consunter Surplus
Producer Surplus
Tax Revenue
0
Deadweight Loss
0
After Tax
(Dollars)