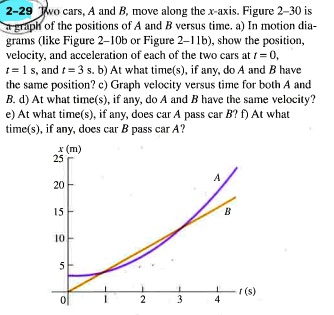
2-29 Two cars, A and B, move along the x-axis. Figure 2-30 is
a graph of the positions of A and B versus time. a) In motion dia-
grams (like Figure 2-10b or Figure 2-11b), show the position,
velocity, and acceleration of each of the two cars at $t = 0$,
$t = 1$ s, and $t = 3$ s. b) At what time(s), if any, do A and B have
the same position? c) Graph velocity versus time for both A and
B. d) At what time(s), if any, do A and B have the same velocity?
e) At what time(s), if any, does car A pass car B? f) At what
time(s), if any, does car B pass car A?