Name:
1118 Section:
Physics 1118
Hooke's Law (Graphing) - Prelab
Finish the exercise and submit it to Brightspace before the due date.
[The prelab is worth 10% of your lab mark.]
In this lab, you are required to write a lab report with a graph. Finish the readings listed below. Practice how to draw the best-fit line and find its slope with the data points given on the graph in the exercise.
Read: (Check the box after you read the document.)
◻ The lab manual of "Hooke's Law (Graphing)"
◻ "Graphing: Basic"
◻ "Lab Report Requirement"
◻ "Sample Lab Report"
What to bring to the lab:
A copy of the lab manual "Hooke's Law (Graphing)"
(You can bring a hard copy or a soft copy on your laptop.)
Ruled paper
Graph paper (1mm grids)
Exercises:
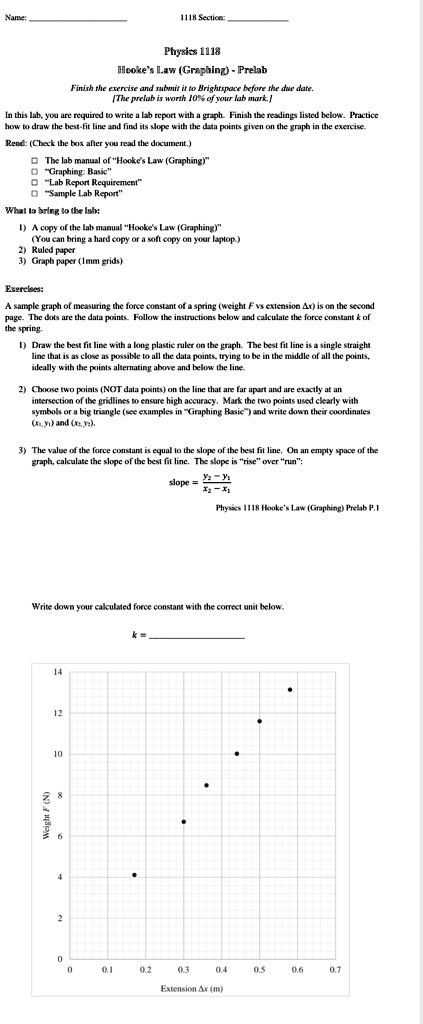
A sample graph of measuring the force constant of a spring (weight F vs extension Δx) is on the second page. The dots are the data points. Follow the instructions below and calculate the force constant k of the spring.
Draw the best fit line with a long plastic ruler on the graph. The best fit line is a single straight line that is as close as possible to all the data points, trying to be in the middle of all the points, ideally with the points alternating above and below the line.
Choose two points (NOT data points) on the line that are far apart and are exactly at an intersection of the gridlines to ensure high accuracy. Mark the two points used clearly with symbols or a big triangle (see examples in "Graphing Basic") and write down their coordinates (x₁, y₁) and (x₂, y₂).
The value of the force constant is equal to the slope of the best fit line. On an empty space of the graph, calculate the slope of the best fit line. The slope is "rise" over "run":
slope = (y₂ - y₁) / (x₂ - x₁)
Physics 1118 Hooke's Law (Graphing) Prelab P. 1
Write down your calculated force constant with the correct unit below.
k=