Texts:
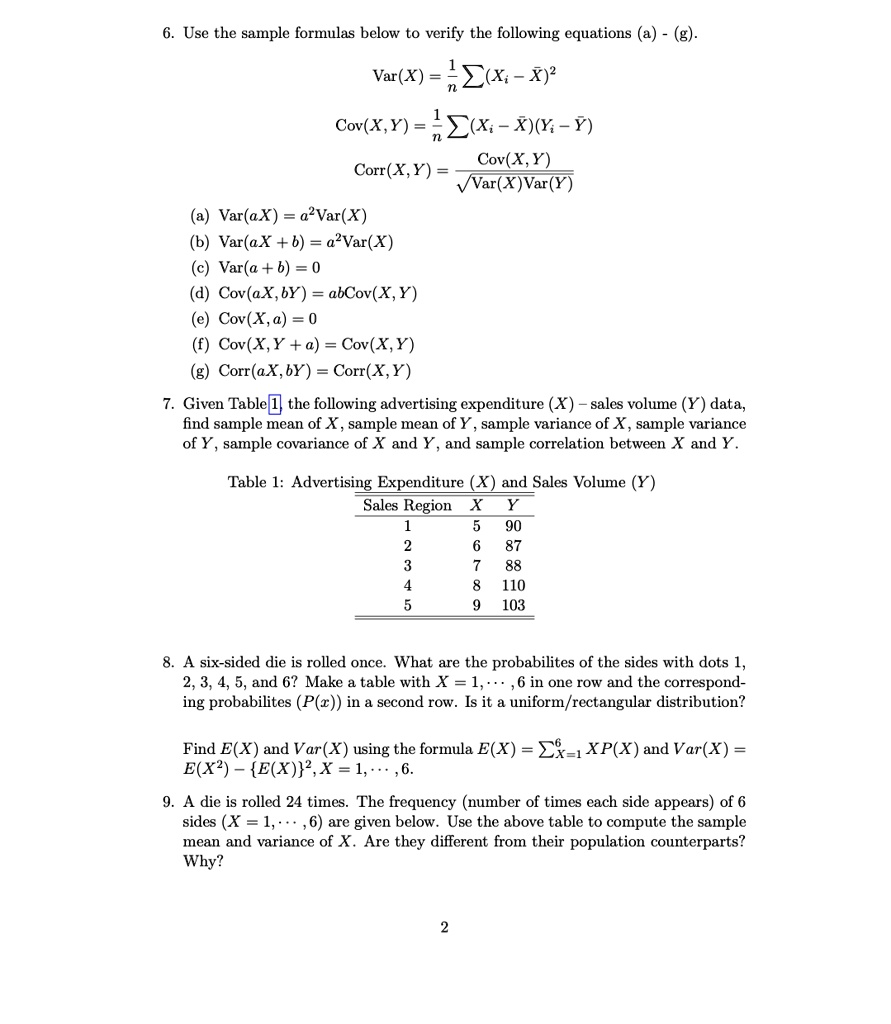
6. Use the sample formulas below to verify the following equations (a) - (g):
a) Var(aX) = a^2Var(X)
b) Var(aX+b) = a^2Var(X)
c) Var(a+b) = 0
d) Cov(aX,bY) = abCov(X,Y)
e) Cov(X,a) = 0
f) Cov(X,Y+a) = Cov(X,Y)
g) Corr(aX,bY) = Corr(X,Y)
7. Given Table 1, the following advertising expenditure (X) -- sales volume (Y) data, find the sample mean of X, sample mean of Y, sample variance of X, sample variance of Y, sample covariance of X and Y, and sample correlation between X and Y.
Table 1: Advertising Expenditure (X) and Sales Volume (Y)
Sales Region X Y
1 5 90
2 9 87
3 7 88
4 8 110
5 9 103
8. A six-sided die is rolled once. What are the probabilities of the sides with dots 1, 2, 3, 4, 5, and 6? Make a table with X = 1,... ,6 in one row and the corresponding probabilities (P()) in a second row. Is it a uniform/rectangular distribution?
Find E(X) and Var(X) using the formula E(X) = EX = 1XP(X) and Var(X) = EX^2 - (EX)^2, X = 1,...,6.
9. A die is rolled 24 times. The frequency (number of times each side appears) of the 6 sides (X = 1,...,6) are given below. Use the above table to compute the sample mean and variance of X. Are they different from their population counterparts? Why?
2