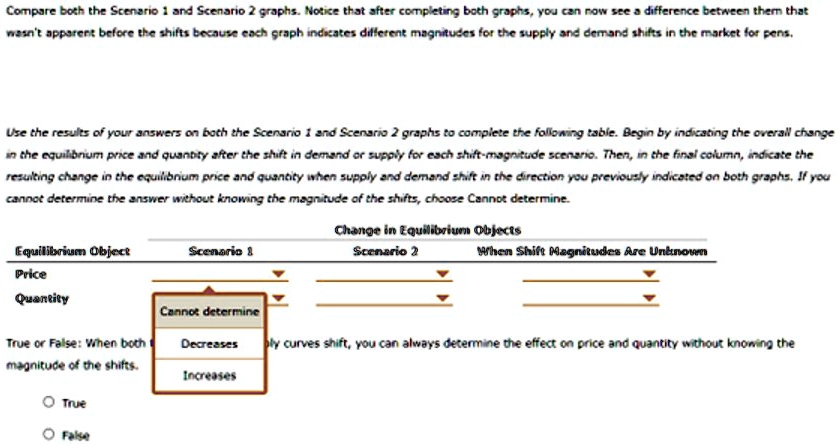
Compare both the Scenario 1 and Scenario 2 graphs. Notice that after completing both graphs, you can now see a difference between them that wasn't apparent before the shifts because each graph indicates different magnitudes for the supply and demand shifts in the market for pens.
Use the results of your answers on both the Scenario 1 and Scenario 2 graphs to complete the following table. Begin by indicating the overall change in the equilibrium price and quantity after the shift in demand or supply for each shift-magnitude scenario. Then, in the final column, indicate the resulting change in the equilibrium price and quantity when supply and demand shift in the direction you previously indicated on both graphs. If you cannot determine the answer without knowing the magnitude of the shifts, choose Cannot determine.
Equilibrium Object
Price
Scenario 1
Change in Equilibrium Objects
Scenario 2
When Shift Magnitudes Are Unknown
Quantity
Cannot determine
True or False: When both
Decreases
bly curves shift, you can always determine the effect on price and quantity without knowing the
magnitude of the shifts.
Increases
O True
False