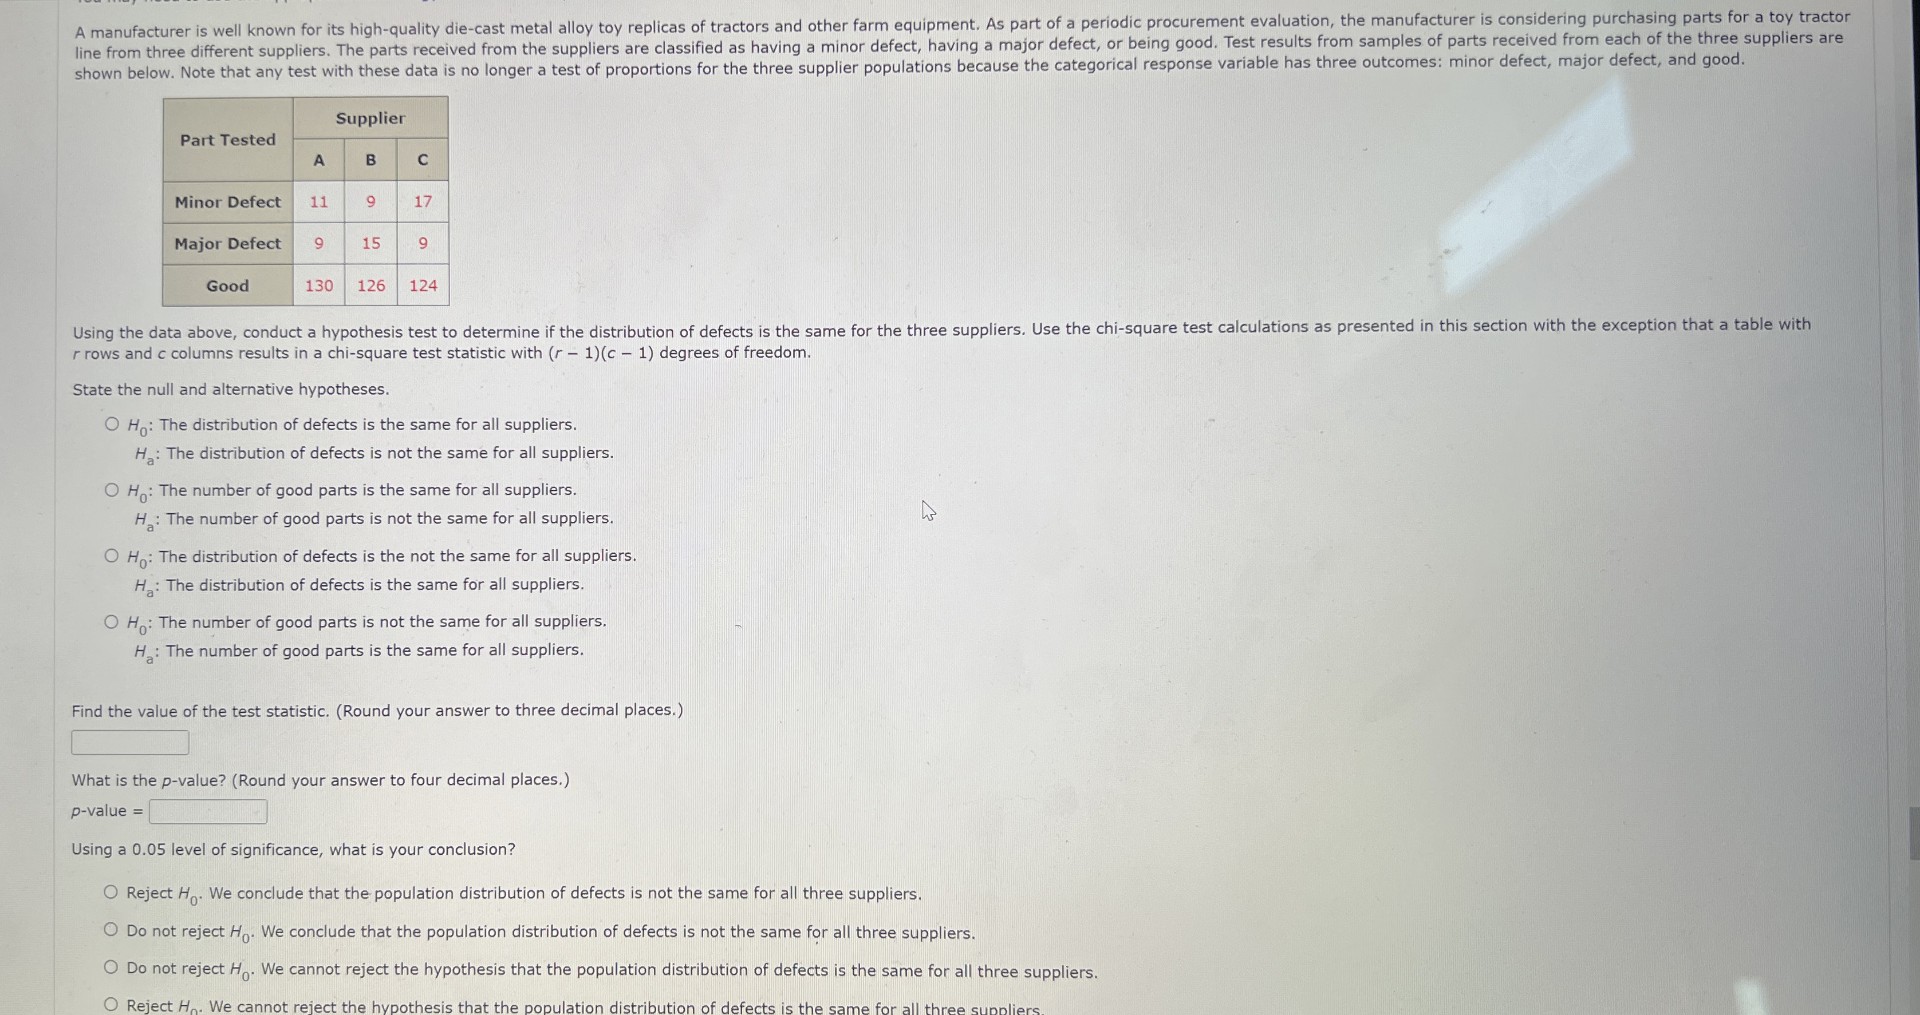
A manufacturer is well known for its high-quality die-cast metal alloy toy replicas of tractors and other farm equipment. As part of a periodic procurement evaluation, the manufacturer is considering purchasing parts for a toy tractor line from three different suppliers. The parts received from the suppliers are classified as having a minor defect, having a major defect, or being good. Test results from samples of parts received from each of the three suppliers are shown below. Note that any test with these data is no longer a test of proportions for the three supplier populations because the categorical response variable has three outcomes: minor defect, major defect, and good.
�egin{tabular}{|c|c|c|c|}
hline multirow{2}{*}{ Part Tested } & multicolumn{3}{|c|}{ Supplier } \
cline { 2 - 4 } & A & B & C \
hline Minor Defect & 11 & 9 & 17 \
hline Major Defect & 9 & 15 & 9 \
hline Good & 130 & 126 & 124 \
hline
end{tabular}
Using the data above, conduct a hypothesis test to determine if the distribution of defects is the same for the three suppliers. Use the chi-square test calculations as presented in this section with the exception that a table with $r$ rows and $c$ columns results in a chi-square test statistic with $(r-1)(c-1)$ degrees of freedom.
State the null and alternative hypotheses.
$H_0$: The distribution of defects is the same for all suppliers.
$H_a$: The distribution of defects is not the same for all suppliers.
$H_0$: The number of good parts is the same for all suppliers.
$H_a$: The number of good parts is not the same for all suppliers.
$H_0$: The distribution of defects is the not the same for all suppliers.
$H_a$: The distribution of defects is the same for all suppliers.
$H_0$: The number of good parts is not the same for all suppliers.
$H_a$: The number of good parts is the same for all suppliers.
Find the value of the test statistic. (Round your answer to three decimal places.)
What is the $p$-value? (Round your answer to four decimal places.)
$p$-value =
Using a 0.05 level of significance, what is your conclusion?
Reject $H_0$. We conclude that the population distribution of defects is not the same for all three suppliers.
Do not reject $H_0$. We conclude that the population distribution of defects is not the same for all three suppliers.
Do not reject $H_0$. We cannot reject the hypothesis that the population distribution of defects is the same for all three suppliers.
Reject $H_0$. We cannot reject the hypothesis that the population distribution of defects is the same for all three suppliers.