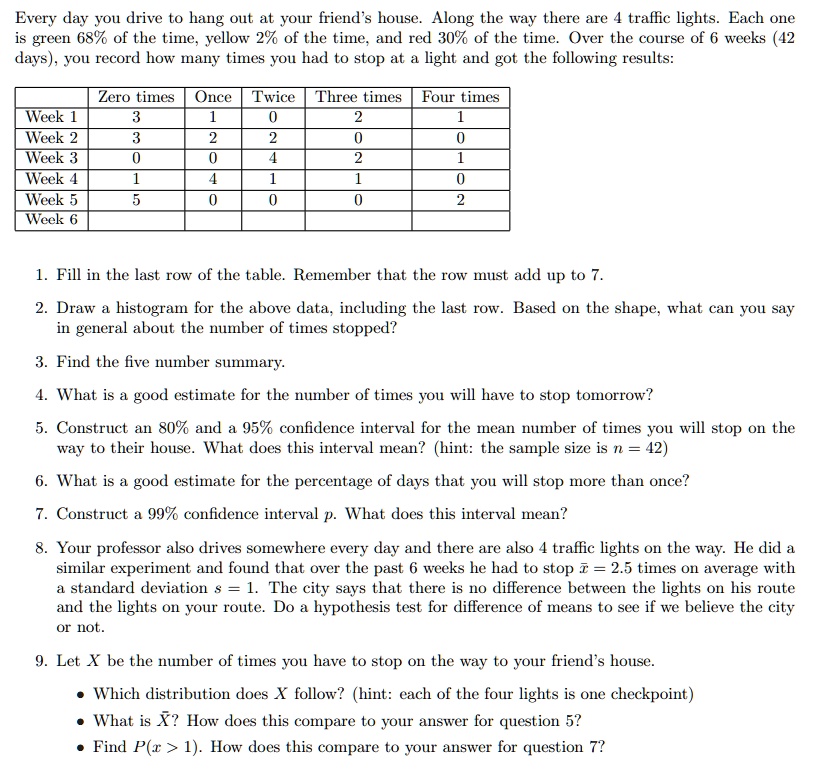
Every day you drive to hang out at your friend's house. Along the way there are 4 traffic lights. Each one is green 68% of the time, yellow 2% of the time, and red 30% of the time. Over the course of 6 weeks (42 days), you record how many times you had to stop at a light and got the following results:
Zero times Once Twice Three times Four times Week 1 3 1 0 2 1 Week 2 3 2 2 0 0 Week 3 0 0 4 2 1 Week 4 1 4 1 1 0 Week 5 5 0 0 0 2 Week 6
1. Fill in the last row of the table. Remember that the row must add up to 7
2. Draw a histogram for the above data, including the last row. Based on the shape, what can you say in general about the number of times stopped?
3. Find the five number summary.
4. What is a good estimate for the number of times you will have to stop tomorrow?
5. Construct an 80% and a 95% confidence interval for the mean number of times you will stop on the way to their house. What does this interval mean? (hint: the sample size is n = 42)
6. What is a good estimate for the percentage of days that you will stop more than once?
7. Construct a 99% confidence interval p. What does this interval mean?
8. Your professor also drives somewhere every day and there are also 4 traffic lights on the way. He did similar experiment and found that over the past 6 weeks he had to stop = 2.5 times on average with a standard deviation s = 1. The city says that there is no difference between the lights on his route and the lights on your route. Do a hypothesis test for difference of means to see if we believe the city or not.
9. Let X be the number of times you have to stop on the way to your friend's house
Which distribution does X follow? (hint: each of the four lights is one checkpoint) What is X? How does this compare to your answer for question 5? Find P( > 1). How does this compare to your answer for question 7?