4. Producer surplus for an individual and a market
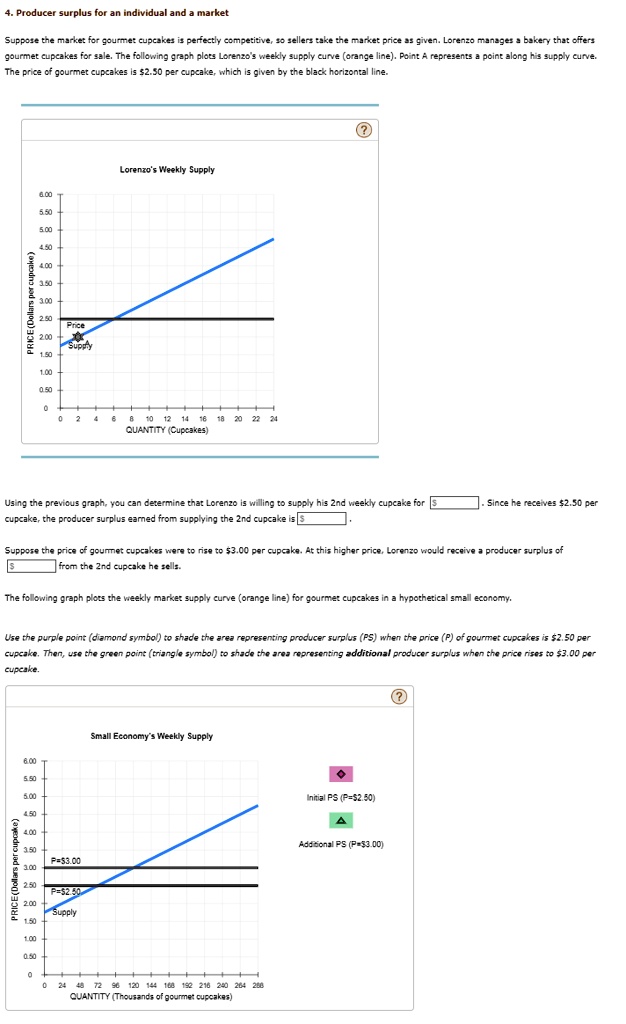
Suppose the market for gourmet cupcakes is perfectly competitive, so sellers take the market price as given. Lorenzo manages a bakery that offers
gourmet cupcakes for sale. The following graph plots Lorenzo's weekly supply curve (orange line). Point A represents a point along his supply curve.
The price of gourmet cupcakes is $2.50 per cupcake, which is given by the black horizontal line.
PRICE (Dollars per cupcake)
Lorenzo's Weekly Supply
5.50
5.00
4.50
4.00
3.50
3.00
2.50 Price
2.00 Supply
1.50
1.00
0.50
0
0 2 4 6 8 10 12 14 16 18 20 22 24
QUANTITY (Cupcakes)
Using the previous graph, you can determine that Lorenzo is willing to supply his 2nd weekly cupcake for $ _____. Since he receives $2.50 per
cupcake, the producer surplus earned from supplying the 2nd cupcake is $
Suppose the price of gourmet cupcakes were to rise to $3.00 per cupcake. At this higher price, Lorenzo would receive a producer surplus of
$ ____ from the 2nd cupcake he sells.
The following graph plots the weekly market supply curve (orange line) for gourmet cupcakes in a hypothetical small economy.
Use the purple point (diamond symbol) to shade the area representing producer surplus (PS) when the price (P) of gourmet cupcakes is $2.50 per
cupcake. Then, use the green point (triangle symbol) to shade the area representing additional producer surplus when the price rises to $3.00 per
cupcake.
Small Economy's Weekly Supply
6.00
P= $3.00
5.50
5.00
P=$2.50
4.50
4.00
3.50
3.00
PRICE (Dollars per cupcake)
2.50
2.00 Supply
1.50
1.00
0.50
0
0 24 48 72 96 120 144 168 192 216 240 264 288
QUANTITY (Thousands of gourmet cupcakes)
Initial PS (P=$2.50)
Additional PS (P=$3.00)