Year
Y
K
N
A
Growth
rate of A
NA
1999
12,610 37,854
134.5
2004
14,406 42,988
136.8
2009
15,208 47,239 135.5
2014
16,912 49,869
143.7
2019 19,091 53,525
155.1
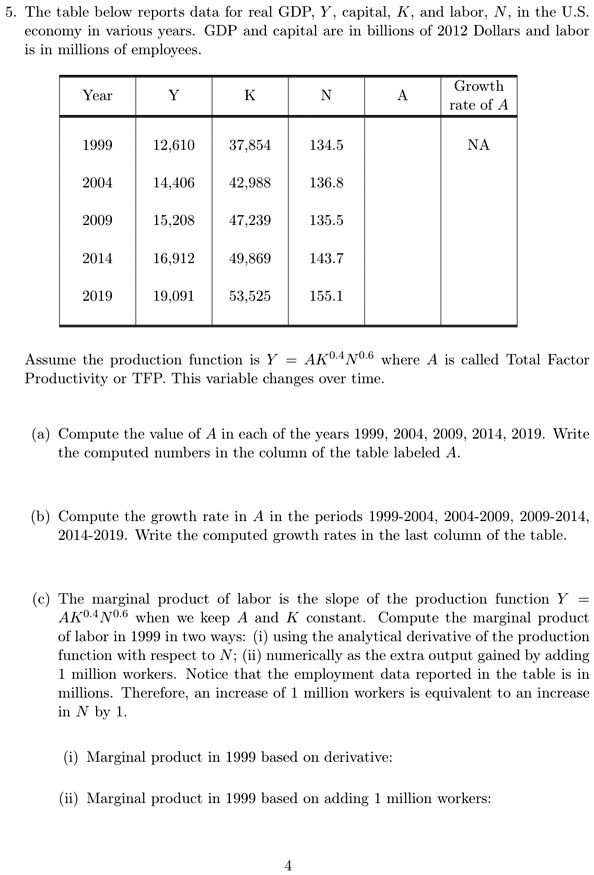
Assume the production function is Y = AK^{0.4}N^{0.6} where A is called Total Factor
Productivity or TFP. This variable changes over time.
(a) Compute the value of A in each of the years 1999, 2004, 2009, 2014, 2019. Write
the computed numbers in the column of the table labeled A.
(b) Compute the growth rate in A in the periods 1999-2004, 2004-2009, 2009-2014,
2014-2019. Write the computed growth rates in the last column of the table.
=
(c) The marginal product of labor is the slope of the production function Y
AK^{0.4}N^{0.6} when we keep A and K constant. Compute the marginal product
of labor in 1999 in two ways: (i) using the analytical derivative of the production
function with respect to N; (ii) numerically as the extra output gained by adding
1 million workers. Notice that the employment data reported in the table is in
millions. Therefore, an increase of 1 million workers is equivalent to an increase
in N by 1.
(i) Marginal product in 1999 based on derivative:
(ii) Marginal product in 1999 based on adding 1 million workers:
4