A ALEKS - Ameera Bello - Learn
N. Ace Al Tutor from Numerade
Lee County Schools
Home
www-awa.aleks.com/alekscgi/x/Isl.exe/10_u-IgNsIkr7j8P3jH-IJS_6JxQUhozV2ZAJZQWQzk-VBhd98uVE3LyZsViA_lu0ZtFZ8YtgiBBMdvpbXDrhEX105aFw
Slope|Bigfoot9999
All Bookmarks
Datn A-niyls and Probabills
identitying the center, spread, and shape of a data set
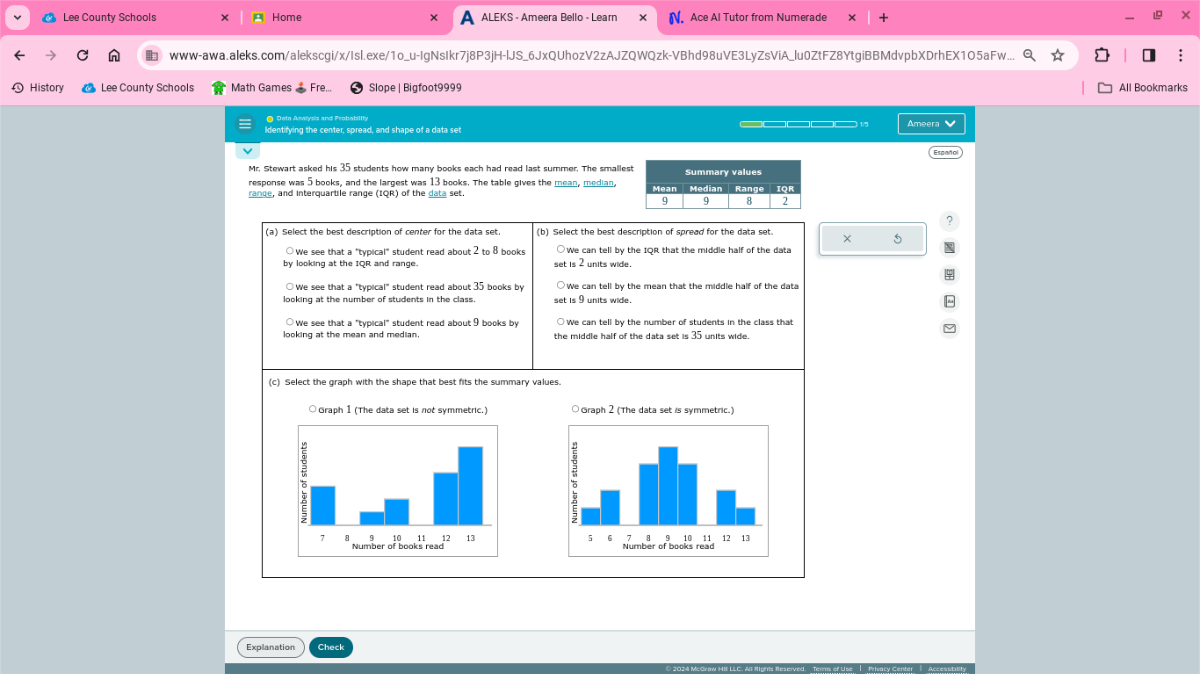
Mr. Stewart asked his 35 students how many books each had read last summer. The smallest. response was 5 books, and the largest was 13 books. The table glves the mean, medlan, range, and interquartile range (IQR) of the data set.
\begin{tabular}{|c|c|c|c|}
\hline \multicolumn{4}{|c|}{ Summary values } \\
\hline Mean & Median & Range & IQR \\
\hline 9 & 9 & 8 & 2 \\
\hline
\end{tabular}
(a) Select the best description of center for the data set.
(b) Select the best description of spread for the data set.
We see that a "typical" student read about 2 to 8 books by looking at the IQR and range.
We see that a "typical" student read about 35 books by looking at the number of students in the class.
We see that a "typical" student read about 9 books by looking at the mean and medlan.
We can tell by the IQR that the middle half of the data set is 2 units wide.
We can tell by the mean that the middle half of the data set is 9 units wide.
O we can tell by the number of students in the class that the middle half of the data set is 35 units wide.
(c) Select the graph with the shape that best fits the summary values.
oraph 1 (The data set is not symmetric.)
Oraph 2 (The data set is symmetric.)
Explanation
Check
Ter in ef Ues
I Nilwacy Certer
[1 Aceceatibity