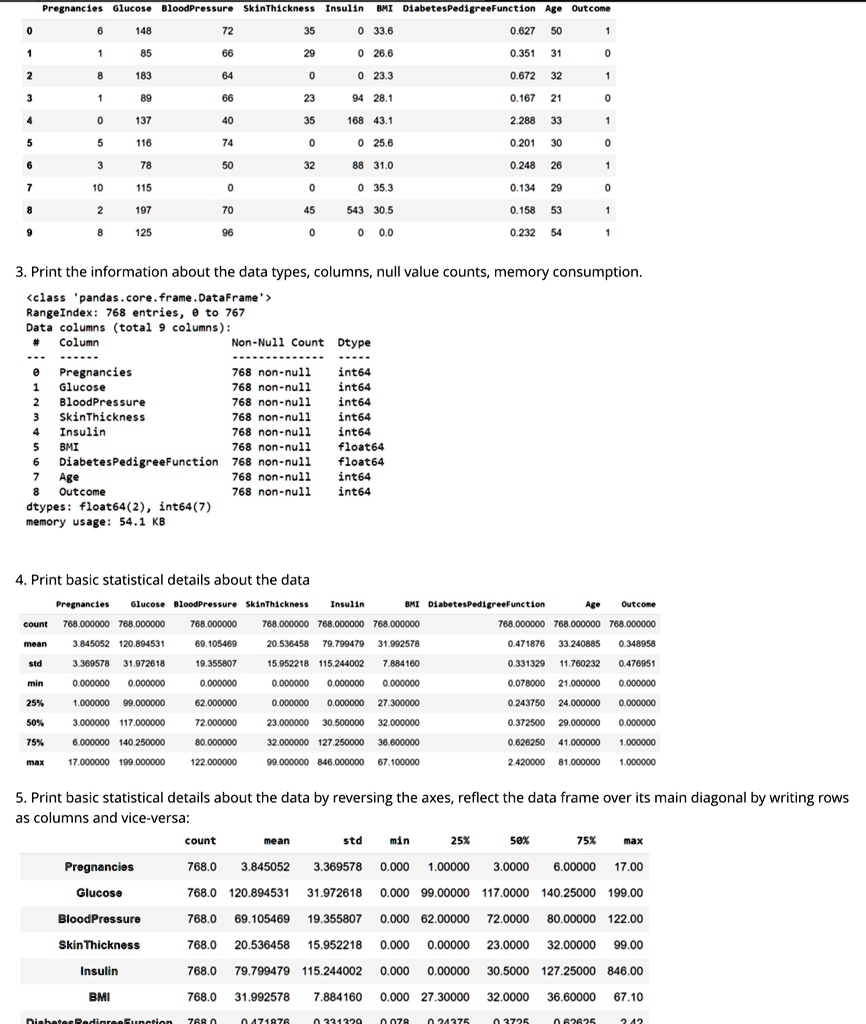
YOU CAN SEE THE TABLE IN THE PICTURE, can you show the solution Task (code) in a step-by-step way. The objective of this data science homework is to explore a healthcare dataset and perform data cleansing using the Pandas library in Python. The project will focus on health dataset aiming to derive insights from the data that can contribute to healthcare. The rate of diabetes is rapidly increasing worldwide. Early detection of diabetes can help prevent or delay the onset of diabetes by initiating lifestyle changes and taking appropriate preventive measures. Prediabetes and type 2 diabetes have proved to be early detection problems. There is a need for easy, rapid, and accurate diagnostic tools for the early diagnosis of diabetes. Machine learning algorithms can help diagnose diseases early. In the first project, you are not going to be developing a machine learning solution just yet. The data set is provided with the homework. The datasets consist of several medical independent variables and one target (dependent) variable, Outcome. Independent variables include the number of pregnancies the patient has had, their BMI, insulin level, and age.
Tasks:
1. Read local data (diabetes.csv) to data frame
2. Print the first 10 rows of the data frame.
3. Print the information about the data types, columns, null value counts, memory consumption.
<class 'pandas.core.frame.DataFrame'>
RangeIndex: 768 entries, θ to 767
Data columns (total 9 columns):
# Column Non-Null Count Dtype
..- -.-.-.
Pregnancies 768 non-null int64
1 Glucose 768 non-null int64
2 BloodPressure 768 non-null int64
3 SkinThickness 768 non-null int64
4 Insulin 768 non-null int64
5 BMI 768 non-null float64
6 DiabetesPedigreefunction 768 non-null float64
7 Age 768 non-null int64
8 Outcome 768 non-null int64
dtypes: float64(2), int64(7)
memory usage: 54.1KB
4. Print basic statistical details about the data
5. Print basic statistical details about the data by reversing the axes, reflect the data frame over its main diagonal by writing rows
as columns and vice-versa:
6. Zero value does not make sense for the following columns:
* Glucose
* BloodPressure
* SkinThickness
* Insulin
* BMI
Treat zero value as missing value and replace them with nan.
7. Plot the data distribution for each column (e.g., Age, BMI, etc.) to better understand how to fill in the missing values.
8. Fill in the nan values for the columns using the right strategy respecting their distribution.
9. Plot the data distribution after filling in the missing data.
Pregnancies Glucose BloodPressure SkinThickness Insulin BMI DiabetesPedigreeFunction Age Outcome 0 6 148 72 35 0 33.6 0.627 50 1 1 85 66 29 0 26.6 0.351 31 0 2 8 183 64 0 0 23.3 0.672 32 3 1 89 66 23 94 28.1 0.167 21 0 4 137 40 35 168 43.1 2.288 33 1 116 74 0 0 25.6 0.201 30 0 6 3 78 50 32 88 31.0 0.248 26 1 7 10 115 0 0 0 35.3 0.134 29 0 8 2 197 70 45 543 30.5 0.158 53 1 9 8 125 96 0 0.0 0.232 54 1
3. Print the information about the data types, columns, null value counts, memory consumption.
<class 'pandas.core.frame.DataFrame'> RangeIndex: 768 entries, to 767 Data columns (total 9 columns: # Column Non-Null Count Dtype ... ...... ..... e Pregnancies 768 non-null int64 1 Glucose 768 non-null int64 2 BloodPressure 768 non-null int64 3 SkinThickness 768 non-null int64 4 Insulin 768 non-null int64 5 BMI 768 non-null float64 6 DiabetesPedigreeFunction 768 non-null float64 7 Age 768 non-null int64 8 Outcome 768 non-null int64 dtypes: float64(2), int64(7) memory usage: 54.1 KB
4. Print basic statistical details about the data Pregnancies Glucose BloodPressure SkinThickness Insulin BMI DiabetesPedigreeFunction Age Outcone count 768.000000 768.000000 768.000000 768.000000 768.000000 768.000000 768.000000 768.000000 768.000000 ueow 3.845052 120.894531 69.105469 20.536458 79.799479 31.992578 0.471876 33.240885 0.348958 std 3.369578 31.972618 19.355807 15.952218 115.244002 7.884160 0.331329 11.760232 0.476951 min 0.000000 0.000000 0000000 0.000000 0.000000 0.000000 0.078000 21.000000 0.000000 25% 1.000000 99.000000 62222000 0.000000 0.000000 27.300000 0.243750 24.0000 0.00000 50% 3.000000 117.000000 72.000000 23.000000 30.500000 32.000000 0.372500 29.000000 0.000000 75% 6.000000 140.250000 80.000000 32.000000 127.250000 0.626250 41.000000 1.000000 max 17.000000 199.000000 122.00000 99.000000 846.000000 67.100000 2.420000 81.000000 1.000000
5. Print basic statistical details about the data by reversing the axes, reflect the data frame over its main diagonal by writing rows as columns and vice-versa: count mean std min 25% 50% 75% max Pregnancies 768.0 3.845052 3.369578 0.000 1.00000 3.0000 6.00000 17.00 Glucose 768.0 120.894531 31.972618 0.000 99.00000 117.0000 140.25000 199.00 BloodPressure 768.0 69.105469 19.355807 0.000 62.00000 72.0000 80.00000 122.00 SkinThickness 768.0 20.536458 15.952218 0.000 0.00000 23.0000 32.00000 99.00 Insulin 768.0 79.799479 115.244002 0.000 0.00000 30.5000 127.25000 846.00 BMI 768.0 31.992578 7.884160 0.000 27.30000 32.0000 36.60000 67.10
0370r