Project 2: Analyzing Sales Data for a Retail Business.
1 Background
You are working as a data analyst for ABC Retail, a small but growing retail business that sells
electronics, home appliances, and furniture both online and in-store. The management team is looking
for insights into their sales performance over the past year and has asked you to analyze their sales
data. The dataset includes information such as product categories, sales volume, prices, regions,
and dates of sales transactions. Your task is to help ABC Retail make better business decisions
by performing data analysis using basic Python operations, such as list manipulation, loops, and
arithmetic calculations.
2 Learning Outcomes
By completing this project you will be able to:
• Use lists to store and manipulate data in Python.
• Perform basic data analysis using loops and arithmetic operations to calculate totals and averages.
Organize and interpret business data using simple list operations (without functions or advanced
libraries).
• Analyze sales trends and performance using Python's built-in features to inform business decisions.
3 Dataset
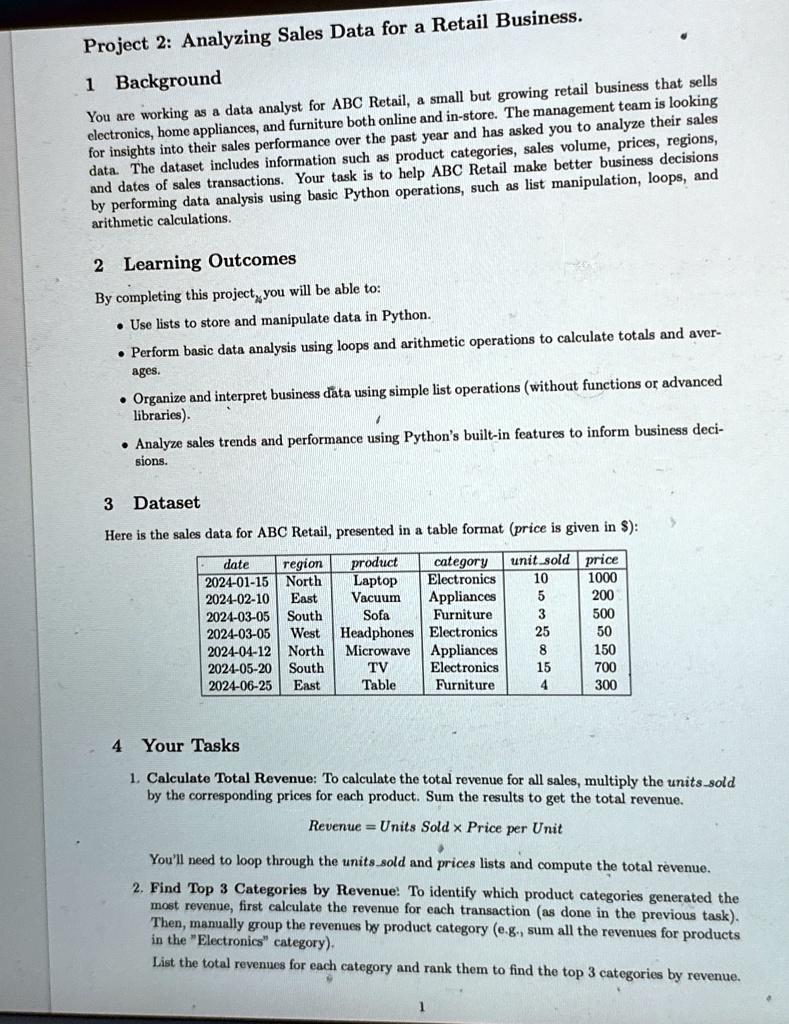
Here is the sales data for ABC Retail, presented in a table format (price is given in $):
date region product category unit_sold price
2024-01-15 North Laptop Electronics 10 1000
2024-02-10 East Vacuum Appliances 5 200
2024-03-05 South Sofa Furniture 3 500
2024-03-05 West Headphones Electronics 25 50
2024-04-12 North Microwave Appliances 8 150
2024-05-20 South TV Electronics 15 700
2024-06-25 East Table Furniture 4 300
4 Your Tasks
1. Calculate Total Revenue: To calculate the total revenue for all sales, multiply the units_sold
by the corresponding prices for each product. Sum the results to get the total revenue.
Revenue = Units Sold $\times$ Price per Unit
You'll need to loop through the units_sold and prices lists and compute the total revenue.
2. Find Top 3 Categories by Revenue: To identify which product categories generated the
most revenue, first calculate the revenue for each transaction (as done in the previous task).
Then, manually group the revenues by product category (e.g., sum all the revenues for products
in the "Electronics" category).
List the total revenues for each category and rank them to find the top 3 categories by revenue.