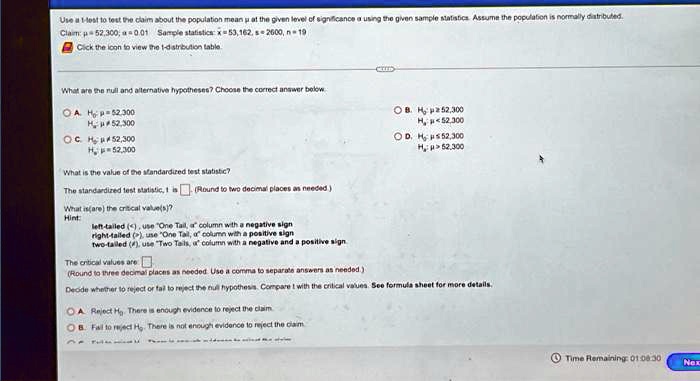
Use a t-test to test the claim about the population mean \(\mu\) at the given level of significance \(\alpha\) using the given sample statistics. Assume the population is normally distributed.
Claim: \(\mu = 52,300\), \(\alpha = 0.01\) Sample statistics: \(\bar{x} = 53,162\), \(s = 2600\), \(n = 19\)
Click the icon to view the t-distribution table
What are the null and alternative hypotheses? Choose the correct answer below
A. \(H_0: \mu = 52,300\)
\(H_1: \mu \neq 52,300\)
C. \(H_0: \mu \neq 52,300\)
\(H_1: \mu = 52,300\)
What is the value of the standardized test statistic?
The standardized test statistic, t is (Round to two decimal places as needed)
What is(are) the critical value(s)?
Hint:
left-tailed \((<)\), use \"One Tail, \alpha\" column with a negative sign
right-tailed \((>)\), use \"One Tail, \alpha\" column with a positive sign
two-tailed \((\neq)\), use \"Two Tails, \alpha\" column with a negative and a positive sign.
The critical values are (Round to three decimal places as needed. Use a comma to separate answers as needed.)
Decide whether to reject or fail to reject the null hypothesis. Compare t with the critical values. See formula sheet for more details.
A. Reject \(H_0\). There is enough evidence to reject the claim
B. Fail to reject \(H_0\). There is not enough evidence to reject the claim
B. \(H_0: \mu \geq 52,300\)
\(H_1: \mu < 52,300\)
D. \(H_0: \mu \leq 52,300\)
\(H_1: \mu > 52,300\)