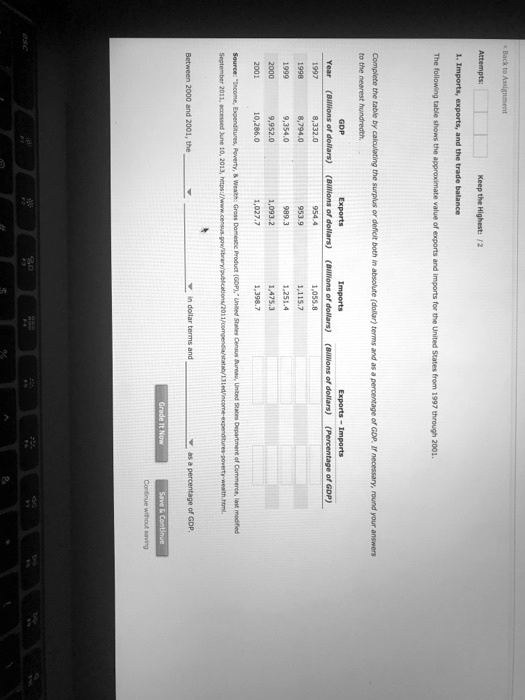
2001 2000 1996 1997 Year attempts: back to Assign Between 2000 and 2001, the to the nearest hundredth. Complete the table by calculating Source Income, Expenditures, Poverty, & Wealth Gross 10,286.0 9,952.0 9,354.0 8,794.0 8,332.0 Billions of dollars) GDP The following table shows the approximate value of exports, imports, and the trade balance in the 1,093.2 953.9 954.4 Billions of dollars) Exports or Keep the Highest: /2 deficit both in absolute (dollar) terms and as a percentage of GDP. Imports 1,398.7 1,475.3 1,251.4 1,115.7 1,055.8 Billions of dollars Exports-Imports for the United Billions of dollars) and as a percentage of GDP from States Exports-Imports age of GDP. In as a percentage of GDP Save & Continue age of GDP Round your answer.