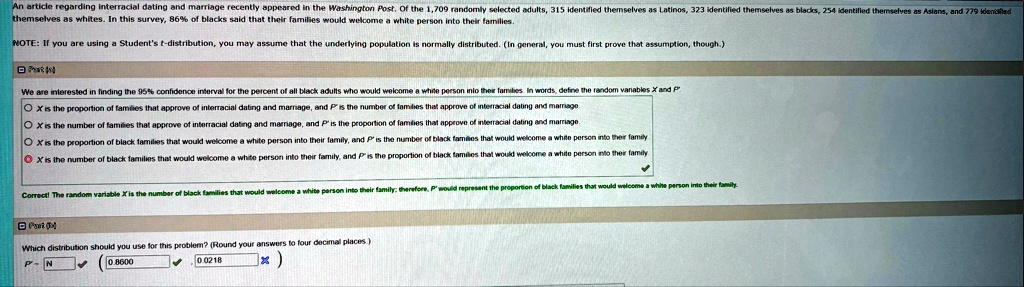
An article regarding interracial dating and marriage recently appeared in the Washington Post. Of the 1,709 randomly selected adults, 315 identified themselves as Latinos, 323 identified themselves as blacks, 254 identified themselves as Asians, and 779 Identified
themselves as whites. In this survey, 86% of blacks said that their families would welcome a white person into their families.
NOTE: If you are using a Student's t-distribution, you may assume that the underlying population is normally distributed. (In general, you must first prove that assumption, though.)
We are interested in finding the 95% confidence interval for the percent of all black adults who would welcome a white person into their families. In words, define the random variables $X$ and $P$.
$X$ is the proportion of families that approve of interracial dating and marriage, and $P$ is the number of families that approve of interracial dating and marriage.
$X$ is the number of families that approve of interracial dating and marriage, and $P$ is the proportion of families that approve of interracial dating and marriage.
$X$ is the proportion of black families that would welcome a white person into their family, and $P$ is the number of black families that would welcome a white person into their family.
$X$ is the number of black families that would welcome a white person into their family, and $P$ is the proportion of black families that would welcome a white person into their family.
Correct! The random variable $X$ is the number of black families that would welcome a white person into their family; therefore, $P$ would represent the proportion of black families that would welcome a white person into their family.
Which distribution should you use for this problem? (Round your answers to four decimal places.)
$P = 0.8600$
$N = 0.0218$