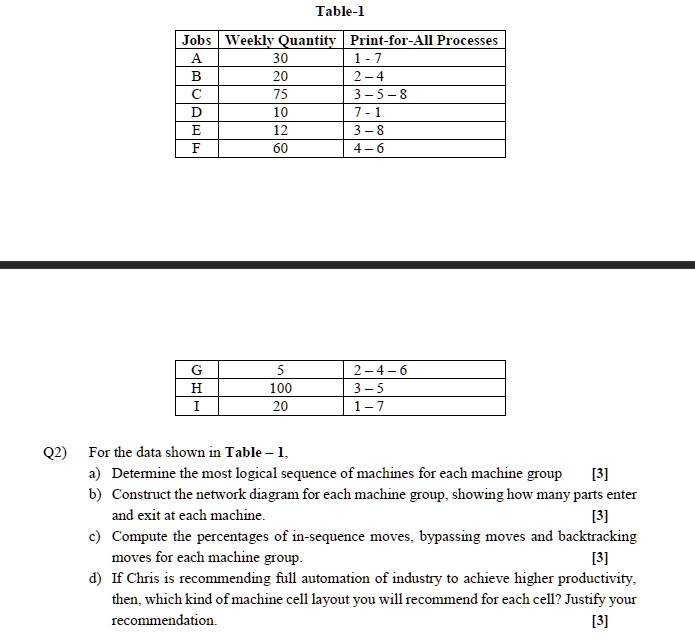
Table-1
Jobs Weekly Quantity Print-for-All Processes
A
30
1-7
B
20
2-4
C
75
3-5-8
D
10
7-1
E
12
3-8
F
60
4-6
G
5
2-4-6
H
100
3-5
I
20
1-7
Q2) For the data shown in Table - 1,
[3]
a) Determine the most logical sequence of machines for each machine group
b) Construct the network diagram for each machine group, showing how many parts enter
and exit at each machine.
[3]
c) Compute the percentages of in-sequence moves, bypassing moves and backtracking
moves for each machine group.
[3]
d) If Chris is recommending full automation of industry to achieve higher productivity,
then, which kind of machine cell layout you will recommend for each cell? Justify your
recommendation.
[3]