1. Answer the following questions using Minitab software and write your conclusions:
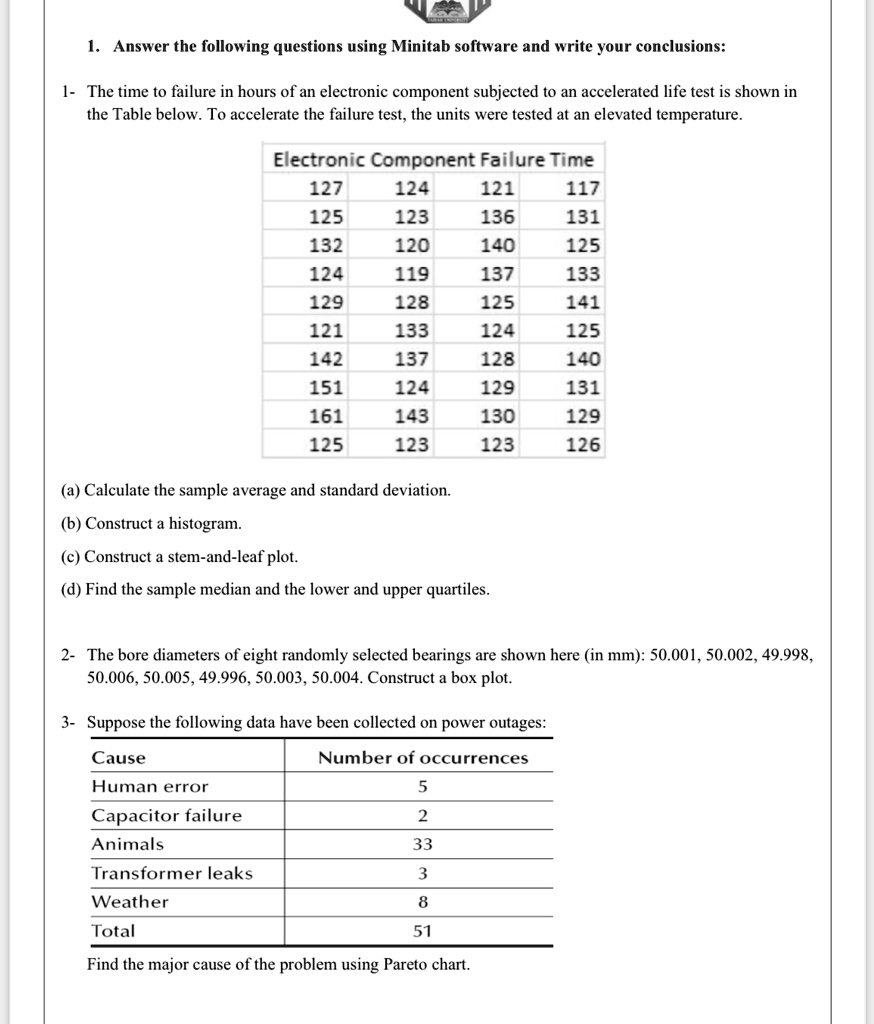
1- The time to failure in hours of an electronic component subjected to an accelerated life test is shown in
the Table below. To accelerate the failure test, the units were tested at an elevated temperature.
Electronic Component Failure Time
127
124
121
117
125
123
136
131
132
120
140
125
124
119
137
133
129
128
125
141
121
133
124
125
142
137
128
140
151
124
129
131
161
143
130
129
125
123
123
126
(a) Calculate the sample average and standard deviation.
(b) Construct a histogram.
(c) Construct a stem-and-leaf plot.
(d) Find the sample median and the lower and upper quartiles.
2- The bore diameters of eight randomly selected bearings are shown here (in mm): 50.001, 50.002, 49.998,
50.006, 50.005, 49.996, 50.003, 50.004. Construct a box plot.
3- Suppose the following data have been collected on power outages:
Cause
Number of occurrences
Human error
5
Capacitor failure
2
Animals
33
Transformer leaks
3
Weather
8
Total
51
Find the major cause of the problem using Pareto chart.