Nilsen and colleagues studied the water relations of individuals of Prosopis glandulosa near the Salton Sea. How would you expect the leaf conductance (open circles; Fig 3) to change for Tree 1 if the vapor pressure deficit (open circles; Fig 1) was held constant at 2 kPa for the entire day? Include a paragraph explaining your reasoning, and properly labeled sketched graphs in your answer.
Nilsen and colleagues (Nilsen et al. 1981) studied the water relations of individuals of Prosopis glandulosa near the Salton Sea. We discussed their results in our classroom activity, and I want you to expand on the topics we have covered in the Osmosis, Transpiration & Water Relations classes to answer the questions below.
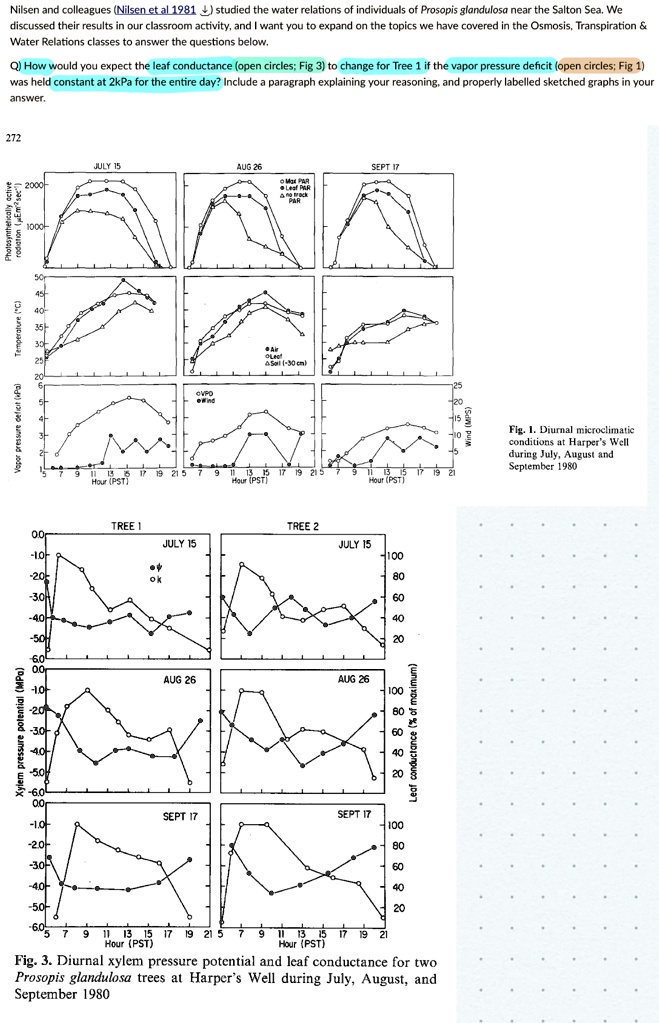
Q) How would you expect the leaf conductance (open circles; Fig 3) to change for Tree 1 if the vapor pressure deficit (open circles; Fig 1) was held constant at 2 kPa for the entire day? Include a paragraph explaining your reasoning, and properly labeled sketched graphs in your answer.
JULY 15 AUG 26 SEPT 17 20 35 Vapor pressure deficit (kPa) TREE 1 0 JULY 15 -10 -20 -30 -40 Fig. 1. Diurnal microclimatic conditions at Harper's Well during July, August, and September 1980 TREE 2 JULY 15 100 80 60 60 AUG 26 AUG 26 100 -10 20 30 40 50 60 00 09 40 20 Leaf SEPT 17 100 SEPT 17 80 60 40 20 0 -1.0 -2.0 -3.0 09 40 5 20 60 7 6 13 15 17 19 21 23 Hour (PST) Hour (PST) Fig. 3. Diurnal xylem pressure potential and leaf conductance for two Prosopis glandulosa trees at Harper's Well during July, August, and September 1980