QUESTION 5
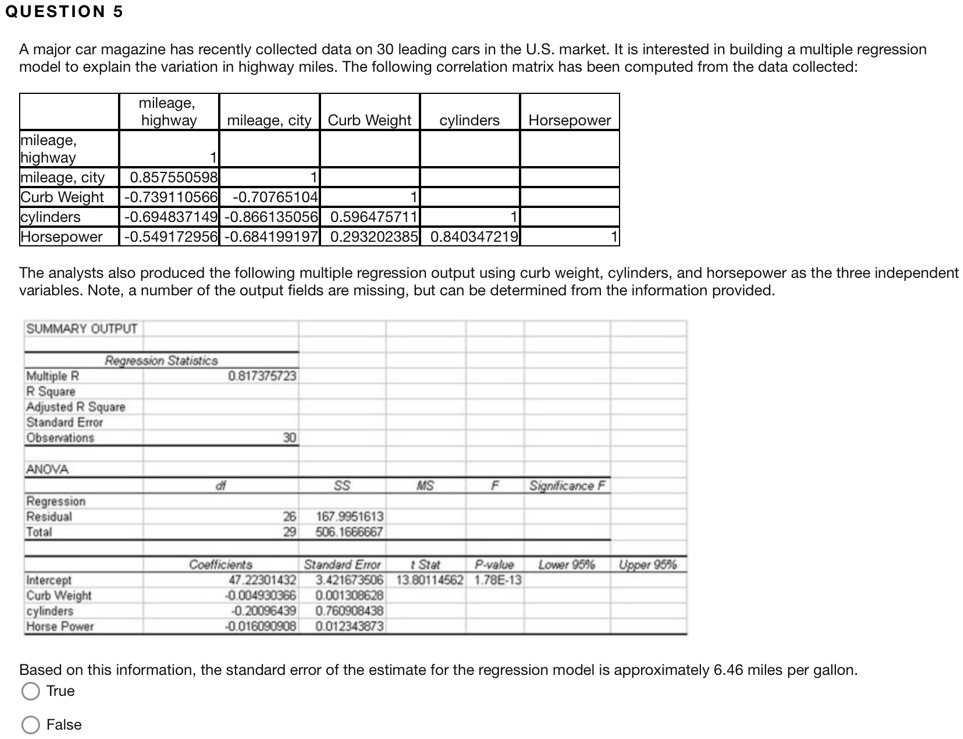
A major car magazine has recently collected data on 30 leading cars in the U.S. market. It is interested in building a multiple regression model to explain the variation in highway miles. The following correlation matrix has been computed from the data collected:
mileage, highway mileage, city Curb Weight cylinders Horsepower
mileage, highway 1
mileage, city 0.857550598 1
Curb Weight -0.739110566 -0.70765104 1
cylinders -0.694837149 -0.866135056 0.596475711 1
Horsepower -0.549172956 -0.684199197 0.293202385 0.840347219 1
The analysts also produced the following multiple regression output using curb weight, cylinders, and horsepower as the three independent variables. Note, a number of the output fields are missing, but can be determined from the information provided.
SUMMARY OUTPUT
Regression Statistics
Multiple R 0.817375723
R Square
Adjusted R Square
Standard Error
Observations 30
ANOVA
df SS MS F Significance F
Regression
Residual 26 167.9951613
Total 29 506.1666667
Coefficients Standard Error t Stat P-value Lower 95% Upper 95%
Intercept 47.22301432 3.421673506 13.80114562 1.78E-13
Curb Weight -0.004930366 0.001308628
cylinders -0.20096439 0.760908438
Horse Power -0.016090908 0.012343873
Based on this information, the standard error of the estimate for the regression model is approximately 6.46 miles per gallon.
True
False