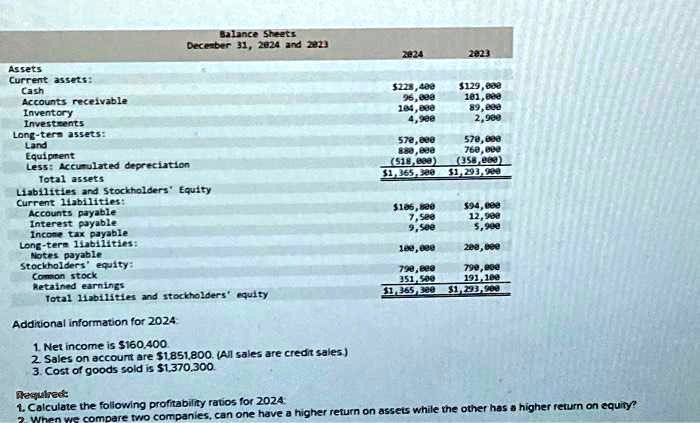
Balance Sheets
December 31, 2024 and 2823
Assets
Current assets:
Cash
Accounts receivable
Inventory
Investments
Long-term assets:
Land
Equipment
Less: Accumulated depreciation
Total assets
Liabilities and Stockholders' Equity
Current liabilities:
Accounts payable
Interest payable
Income tax payable
Long-term liabilities:
Notes payable
Stockholders' equity:
Common stock
Retained earnings
Total liabilities and stockholders' equity
Additional information for 2024:
1. Net income is $160,400.
2. Sales on account are $1,851,800. (All sales are credit sales.)
3. Cost of goods sold is $1,370,300.
Requirek
1. Calculate the following profitability ratios for 2024
2824
2023
$228,400
$129,000
96,000
101,000
104,000
89,000
4,900
2,900
578,000
578,000
880,000
760,000
(518,000)
(358,000)
$1,365,300
$1,293,900
$106,800
$94,000
7,500
12,900
9,500
5,900
100,000
200,000
790,000
790,000
351,500
191,100
$1,365,300
$1,293,900
2. When we compare two companies, can one have a higher return on assets while the other has a higher return on equity?